

How do you tell humanity that its time may be at an end?

My name is Stephen Carter, and what I’d like you to know about me before you read the following article is that I am a former theoretical physicist.
That means while I am not trained as a climate scientist I am also no stranger to the arguments scientists make about the state of the physical world. So I feel at least moderately equipped to sort the wheat from the chaff when it comes to claims made in the name of climate change.
These days I write copy for a living, but today I’m putting on my environmentalist hat and writing about the topic of climate change as though our lives depended on it. Because, quite frankly, they do.
Let me tell you all about why I believe this to be the case.
Towards the beginning of 2018 I cottoned onto the idea that perhaps the severity of the global warming “crisis” was something that by far the majority of us had underestimated. I had never questioned it was happening, but perhaps like most I viewed it as a problem which could have serious implications for the continued well-being of the human race towards the end of the 21st century.
That seemed a long way off to me.
Except now I was hearing the timeframe might be wrong. Like, possibly it was all to be moved up by half a century or more. Maybe even that catastrophic events could be just around the corner…
Those once-in-a-century tropical hurricanes that now sweep in from the ocean every decade or so and flatten the landscape? The droughts? The floods? The excessive heat waves and region-destabilizing famines? The sea rise intensified storm surges? The whatever-kind-of-freak-weather event that might have visited your neck of the woods in the very recent past?
It got me thinking that maybe playing down those events as unlucky coincidences has been more wishful thinking on our part than the frequency-of-occurrence evidence suggests.
I wondered whether those climate change warnings the scientists have been hollering about since the 1980s might actually deserve a closer look.
So that’s what I did.
I spent more than six months obsessively looking into this topic. As likely happens with most newcomers to this subject I quickly found myself struggling to wrap my head around some very extreme predictions of climate catastrophe within the decade. Basically your worse horror story come true on the human race, culminating in it being wiped from the face of the planet. Surely nonsense. Except…
Except the scenario was based on a very solid grain of truth that, as a former scientist who can recognize what’s outright nonsense when it comes to physical arguments and what just might not be, I couldn’t completely dismiss the scenario and just go back to rest of my life. I am a father. So, I have to know. And if you have children I think you probably want to know as well. Just how bad is it really?
Well, now that I’ve put in the effort to find out, I can tell you.
The ten year time frame is wrong (you’re thinking, duh, of course it is). But it’s not so wrong you can now breathe a comfortable sigh of relief.
We’ll still be here two decades from now. But three decades? Four decades?
Here’s what should really concern you. Three months into looking for climate catastrophe loopholes and trying to convince myself there’s just no way it cannot all come to a swift end less than 30 years from now, I concluded there aren’t any. Right now I’m convinced the survival of the human race beyond a period exceeding more than a few decades is an open question.
If I am right about this you should be terrified. Everyone on the planet should be terrified. Instead, almost no one is giving this issue any serious thought at all. Yes, we all know that climate change is a concern, but if you are not currently losing sleep over it you are nowhere near having a proper appreciation of what is at stake.
Well, I’m going to try to change that. If you keep reading I expect by the end of this article you will be giving the issue some very considerable thought indeed.
But before we get started, let me tell you just a little bit more about myself. Just enough perhaps to help you figure out how much weight you should be assigning to what it is I’m trying to tell you…
Now, until this year I had lived in the United States for 25 years as a foreign resident. I came here as a postdoctoral fellow in the 1990s. For a few years I was attached to the California Institute of Technology, where I supposedly dabbled in physics. But that chapter of my life did not work out so well and eventually I became a writer of science-based fiction. Today I pass as a copywriter (someone who writes sales material).
For the longest time I put off becoming a U.S. citizen. It just never seemed all that urgent. This, despite having a teenage son who was born here. But after three months of teaching myself the basics of climate change science and reluctantly coming to the conclusion that we are indeed in very serious trouble I naturalized. The bottom line is this: I wasn’t going to risk finding myself outside the country as a non-citizen and possibly being excluded from re-entering it after the world wakes up to what’s actually happening today and what will happen in the coming decades. I am not willing to be separated from my son if the worst comes to pass.
It’s not all bad news. In this story there is room for a miracle.
If it happens we will survive as a species. We’re certainly not going to like the world we find ourselves in, but over a very long period of time (like a century or more) we might be able to fix things.
It could happen. It’s not likely to happen. But still, I’m rooting for that miracle.
In the remainder of this article, which I will admit has grown to be much longer than I planned, I’m going to share with you a lot of what I discovered about the topic of climate change. All the bits that struck me as being particularly noteworthy. If you have been asleep on this topic, as I was, you’re going to learn some very disturbing things. You’ll be free to make up your own mind about what you learn, but I’m not going to hesitate to give you my opinion as we go.
Having said that, none of what you are about to learn is my personal philosophy of climate change. I’m fairly smart, but not smart enough to build out a philosophy of climate change. Everything I tell you about what is going on I have gleaned from watching hundreds of climate scientists give presentations which can be found online, and from having read dozens and dozens of scientific papers on the subject (you’ll find a number of them referenced throughout).
The way I see my job is that I’m in a position to use my science background to analyze a lot of what you might not easily be able to analyze. I’m also fairly good at taking the disconnected parts of a topic and presenting the larger picture in a way that, just maybe, will seem understandable to someone who hasn’t spent years hanging around scientific types and trying to read between their lines.
So, if you’ve read this far here’s what you need to know. I’m going to try to answer for you just one question:
Can we survive climate change?
Or if I’m willing to be less artful about it, just how worried should you be that climate change might kill your children?
Or that it might even be able to kill you?
Admittedly, the answers I’ll provide are not going to be definitive. No one can foretell the future. But, in the interest of fair warning… be prepared for some bad news.
Here’s a list of the section headings so that you can get an idea of the topics we’ll be covering:
- Yes, It’s Getting Warmer – But Is That Really A Problem?
- Why Are Temperatures Rising? Are Greenhouse Gases To Blame?
- Planetary Warming – What Does The Historical Record Tell Us?
- Drivers Of Planetary Temperature – Fast And Slow Time Scales
- Life On An Ice-Free Planet Earth
- The Paris Agreement: Humanity’s Last Hope, Or Climate Mirage?
- Sanity Check – Could Those Worrisome Temperature Projections Be Wrong?
- Runaway Global Warming – If Not Avoidable, Then How Soon?
- The Intergovernmental Panel On Climate Change Moves Up The Timeline For Concern
- The Role Of The Individual – What CAN You Do? What SHOULD You Do?
- World Scientists’ Warning to Humanity: Final Notice
- A Note On What To Think About The Skeptics And The Deniers
Let’s get into it, beginning with the kind of statement you might expect of your run-of-the-mill climate change skeptic…
Yes, It’s Getting Warmer – But Is That Really A Problem?
To kick this off I’d have you look at the graphic at the top of this article. Let me reproduce it here so you don’t have to scroll:
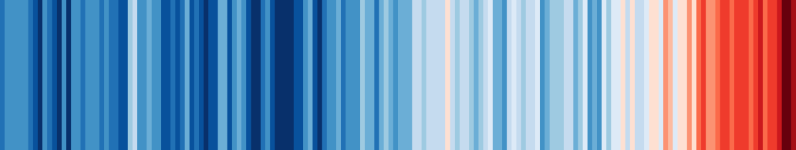
Annual global temperatures from 1850-2017. The color scale represents the change in global temperatures covering 1.35°C [image credit: Ref. HAWKINS]
What this shows is color-coded average global combined sea and land temperatures from the pre-industrial era through to the present. On the left, the blue shades indicate cooler temperatures. On the right, the red shades reveal an ominous pattern: a steady and rapid rise in temperature.
Since about 1980 a steep and unambiguous increase in these world averaged temperatures from one decade to the next has been observed. The global temperature during the period 1980 through to the end of 2017 rose about 0.6 degrees Celsius (averaging about 0.16 degrees per decade).
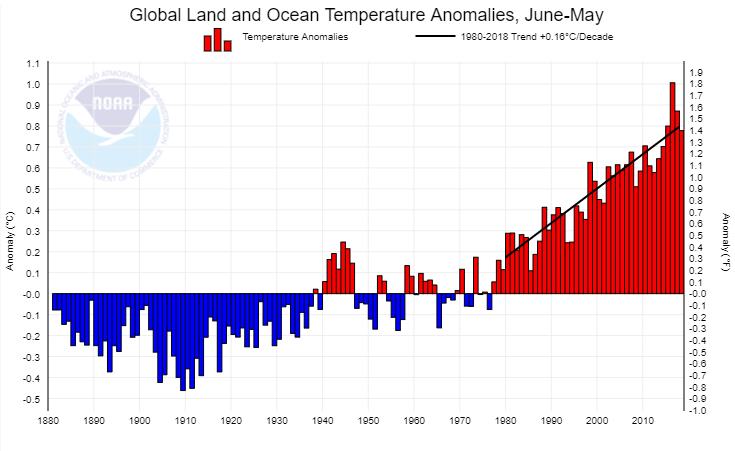
Global temperatures showing rise since 1980 of 0.16 degrees Celsius per decade. [image credit: Ref. NOAA]
Barely more than half a degree?
That doesn’t sound like a whole lot, does it?
A gentle simmering of our world, if you will.
But keep in mind 70 percent of planet Earth is covered in water, so the overall rise in temperature is somewhat tempered by the heat-diluting effect of the ocean.
If instead we were to look at the rise in temperature over a specific land mass, like North America, the effect is noticeably greater. During the same period we discover that the land temperature, while much more variable from one year to the next, rose about 1.0 degrees Celsius on average (0.28 degrees per decade).
Compared to the combined land and ocean temperature rise, the rate of increase in Northern Hemisphere land temperatures is greater by about 40 percent. This makes a huge difference when it comes to interpreting the local effects of global increases of temperature above those of pre-industrial times, the reference period which crops up repeatedly in discussions of climate change.
NOTE: My recommendation is to not think of the scale we use to describe changes in average global temperature as a literal temperature (which in reality it certainly is), but as a kind of climate Richter scale. The severity of the changes to our environment get significantly greater each time we undergo an increase of one degree. Even a change of half a degree, as we will see, can have devastating impacts on the lives of hundreds of millions of people who might not have suffered at the slightly “lower” temperature.
Before we go any further let’s try to get a working definition of that term “pre-industrial” which has cropped up in reference to the change of average global temperature. Pre-industrial refers to the period in history before the wide-scale adoption of coal-powered industries in the 18th century.
Obviously, if we are discussing temperature changes, some kind of reference point which connects an initial temperature to a particular time is needed. When you hear people talk about a world “2 degrees Celsius above pre-industrial times” you need a reference point to make sense of what they are trying to get across to you. Two degrees higher than what?
To cut a long story short, it’s not completely obvious what that term “pre-industrial” should mean. So in 2017 an international team of climate science researchers somewhat arbitrarily recommended we peg 2015 as the year in which global temperatures passed 1 degree Celsius above pre-industrial for the first time [Ref. BASELINE].
This accords with the observation that global temperature in 2015 was about 1 degree Celsius above the average global temperature for the years 1720 to 1800.
Their reason for choosing this period, besides the fact that the temperature did not fluctuate much during those years?
It’s four-fold:
- The period occurs before we began burning fossil fuels in earnest (so it was a time of unspoiled atmospheric composition).
- It was a period relatively free of volcanic eruptions which can emit gases that change the composition and temperature of the atmosphere.
- It was also a period representative of normal solar activity in the two centuries that followed it (i.e. up until today).
- Finally, the concentrations in the atmosphere of carbon dioxide and methane (both greenhouse gases) were representative of concentrations for the last several thousand years (i.e. before we began changing them).
To me, this definition of a “1 degree Celsius above pre-industrial world” seems as good as any other for deciding how to benchmark changes in global temperatures.
Thus, if we adopt the new standard, and with global temperatures rising at roughly 0.16 degrees per decade, a simplistic prediction would suggest we should hit the 2 degrees Celsius above pre-industrial world in the next 6 (or 1 divided by 0.16) decades. That would take us to the year 2075.
This is a comforting time frame. It would put the worst effects of global warming way out ahead of us, practically two generations away.
The trouble is, the world is not going to continue warming at the rate it recently has been. Not by a long shot (I’ll explain why shortly).
We know from somewhat accurate (but also it now appears, increasingly deficient) computer modeling and statistical analyses of the climate system that the average global temperature is expected to rise another 2 to 5 degrees Celsius by the end of the century (3 to 6 degrees above pre-industrial). So in reality we are much more likely to arrive at that 2 degrees Celsius world by as soon as perhaps 2050.
Or if things work out badly for us, and even the higher temperature forecasts prove wanting in accuracy, perhaps much earlier than that.
Why Are Temperatures Rising? Are Greenhouse Gases To Blame?
Perhaps the most surprising aspect of the climate change story is not that we know exactly what is causing the rise in average global temperature, but that we have known about it for so long.
In March of 1912 Popular Mechanics magazine ran a story offering speculation about carbon dioxide (C02) emissions [image credit: Ref. POPMECH1912]:
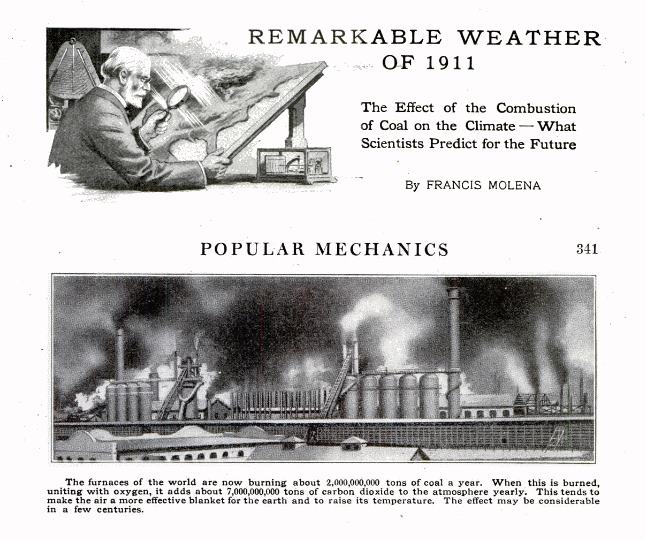
The story shows the warming potential of greenhouse gases was recognized over a century ago. Scientists had by then already determined carbon dioxide (CO2) emissions produced from the burning of coal might one day begin trapping the heat of the Sun, causing the temperature of the atmosphere to rise.
Fourteen years earlier in 1896 the Swedish scientist Svante Arrhenius suggested that carbon dioxide concentrations would influence the equilibrium temperature of the atmosphere [Ref. ARRHENIUS].
Earlier still, in 1859, the English scientist John Tyndall began disclosing his work on the way in which various gases absorb radiated heat energy (which today we would call long-wavelength, or infrared, radiation). In 1861 he published a paper in which he described how C02 readily absorbs in the infrared bands. This result likely provided Arrhenius with the germ of his notions about the interaction of CO2 with the energy re-radiated back into the atmosphere from the Sun-warmed surface of the Earth.
But Tyndall’s work on the effects of carbon dioxide on the atmosphere have even earlier, often overlooked precedence. In 1856 a paper from an American scientist, Eunice Foote, was read before the American Association for the Advancement of Science. It described experiments she had performed which demonstrated the higher heat capacity of both carbon dioxide and water vapor compared to “common air”. Foote postulated of CO2 that “An atmosphere of that gas would give to our earth a high temperature; and if as some suppose, at one period of its history the air had mixed with it a larger portion than at present, an increased temperature from its own action… must have necessarily resulted.” [Ref. FOOTE]
Arrhenius, retreading the same ideas 40 years later, was motivated to understand the relationship between carbon dioxide concentrations and average global temperature because he believed it might be the key to explaining the causes of the great ice ages of the past. It later turned out that a cyclical change (over a period of approximately 100,000 years) in the orbit of the Earth around the Sun, and of the alignment of the Earth’s axis of rotation with respect to that orbital path, is the driver of ice ages.
But carbon dioxide appears to play a big part in how rapidly the Earth comes out of a glacial period (as well as driving wild swings in temperature during the period of general cooling). While the slow descent into an ever-cooler ice-dominated world happens over a period of many tens of thousands of years, the thaw happens over just a few thousand. At the end of the last ice age the average global temperature rose about 5 degrees Celsius in just a few thousand years.
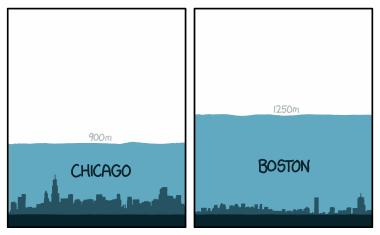
Thickness of ice sheets (in meters) over Chicago and Boston areas 21,000 years ago, compared to city skylines of today [image credit: Ref. XKCD].
Five degrees is the difference between the world you experience today and a climate in which Boston is covered with an ice sheet three quarters of a mile thick [Ref. XKCD]. Keep this in mind when considering the nature of the world we may be heading into shortly where the average global temperature may be 5 degrees warmer than it is today. It’s a completely different world. One that humans have never experienced. Remember, it’s a change of 5 degrees on a Richter scale. It will be as if we have moved to an entirely new planet.
Once Arrhenius was confident that a reduction in CO2 might explain some of the temperature variations seen in the fossil records he turned his thoughts in the other direction.
What would happen, he wondered, if one doubled the concentration of CO2 in the atmosphere from its concentration at the time?
Arrhenius came up with a figure of 5 degrees Celsius for the predicted temperature increase. Given that climate science was in its infancy at the turn of the 19th century his calculation is not far off modern predictions. Prior to the industrial age the molecular concentration of C02 in the atmosphere had been stable at about 280 parts per million (ppm). Doubling that figure would take it to 560 ppm, a value that, all other things being equal (they’re not), one might imagine would take us to a 3 degree Celsius world [Ref. SENS].
SCIENTIST: Actually that tiny concentration of roughly 280 ppm of CO2 throughout the last 10,000 years is the difference between a planet with a stable average temperature of about 15 degrees Celsius and a planet which is essentially a snowball at -18 degrees Celsius. Oxygen and nitrogen, by far the largest components of the atmosphere, are almost completely transparent to infrared energy. If not for the significant capacity of CO2 to absorb in the infrared range planet Earth could never have maintained temperatures sufficiently high enough to encourage the evolution of life. The bottom line is that the equilibrium temperature of the atmosphere is VERY sensitive to the concentration of carbon dioxide.
In late 2016 we reached a CO2 concentration of 400 ppm for the first time. That number has been increasing at a rate of about 2.5 ppm per year (and will continue to do so until we stop burning fossil fuels for energy).
For the most part the world ignored Arrhenius’s observations about the possible effects of putting C02 into the atmosphere. But the idea was out there and it did resurface now and again in mass media publications.
In 1956 an article appeared in The New York Times [Ref. NYTIMES]. It recounted the efforts of scientists of the day to explain the rise in global atmospheric temperature for the previous 60 years (since Arrhenius’s prediction). The story repeated Arrhenius’s claims about the ability of CO2 to warm the atmosphere, and noted that “a rise in the average temperature of only 4 degrees Celsius would convert the polar regions into tropical deserts and jungles…”
That New York Times writer, Waldemar Kaempffert, was not far wrong. As we will see shortly, the melting of sea ice at the North pole and ice sheets at the South pole is well under way and its conclusion for the Arctic in the short term portends climatic catastrophe – not just in the polar region but all across the globe.
Kaempffert was summarizing the work of Dr. Gilbert Plass, a Canadian physicist, about whom a short piece had appeared in the August 1953 issue of Popular Mechanics magazine [image credit: Ref. POPMECH1953]:
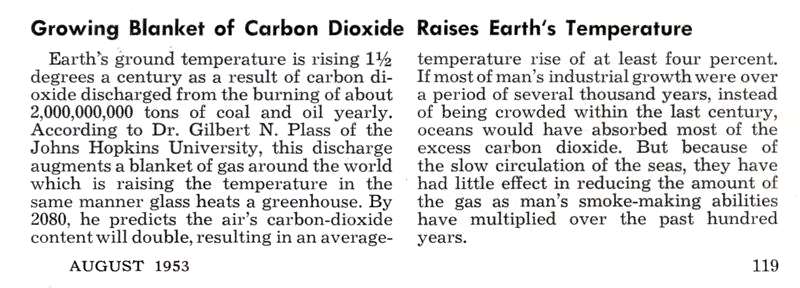
Plass was the first breed of scientists to use high-speed computers of the day to begin modeling the absorption of infrared radiation by the various layers of the Earth’s atmosphere. The accuracy of his predictions about how much the atmosphere would warm in the coming years have proved remarkably prescient.
A very detailed account of his work was published in American Scientist in 1956, an article titled “Carbon Dioxide And The Climate” [Ref. PLASS]. At the time Plass warned that humanity was conducting an uncontrolled large-scale experiment on the atmosphere and that it would just be a matter of time before his conclusions were confirmed by the evidence of a rapidly warming world at the end of the 20th century (which is exactly what has come to pass).
So the idea that carbon dioxide emissions represent a real threat to the stability of the global temperature is a well-established one. It is not speculative science that has yet to receive any real scrutiny. Some of the smartest people on the planet have been giving it their attention for more than half a century. Today the belief among climate science professionals that greenhouse gases are warming the planet is by far the consensus view, with more than 90 percent of the top climate scientists (those who publish consistently) in agreement that carbon dioxide emissions have been the driving force behind climate change and that the source of that CO2 is the human-driven combustion of fossil fuels [Ref. CONSENSUS].
Putting aside all the physical science that goes into explaining the greenhouse effect, as it’s come to be known, the basic idea is easy enough to understand.
A portion of the light from the Sun penetrates the Earth’s atmosphere and makes it to the ground (or ocean) where it is absorbed and raises the temperature (dark surfaces absorb the most energy, light surfaces reflect some of the light and as a consequence warm less).
The warmed land (or water) can then re-radiate that energy at the much longer wavelengths that characterize thermal radiation (infrared energy). It is this longer wavelength radiation that carbon dioxide in the atmosphere absorbs and scatters back towards Earth before it can make its way out to space, thus trapping the heat within the biosphere of the planet.
When the story about the world wide heat wave ran in Popular Mechanics in 1912 the coal furnaces of the world were spewing 7 billion tons of C02 emissions – or 7 gigatons as it is referred to now (see the graph below). Today we are relying less and less on coal for our power needs but we are still burning an astonishing amount of fossil fuels in the form of oil and gas. When emissions from land management practices are factored in (practices that include cutting down forests that pull CO2 from the air and planting in their place greenhouse gas-producing crops like rice), the total is more than 40 gigatons per year.
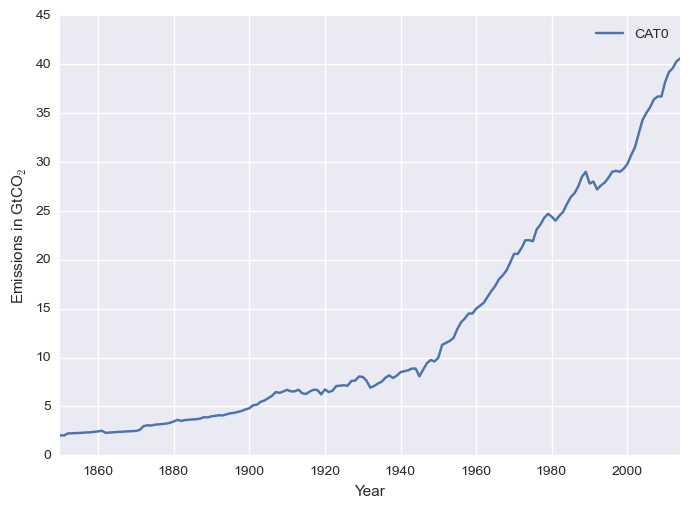
The world wide rate at which carbon dioxide is being pumped into the atmosphere, in gigatons per year, from 1850 to 2014 [image credit: Ref. CATO]
The notion of a “gigaton” as a reference unit is useful to understand because the term comes up again and again in climate science discussions.
To get some appreciation of the quantity of material (water, ice, liquid CO2) represented by a gigaton, picture a cube with sides one kilometer (1000 meters) in length. That cube could hold one gigaton of water.
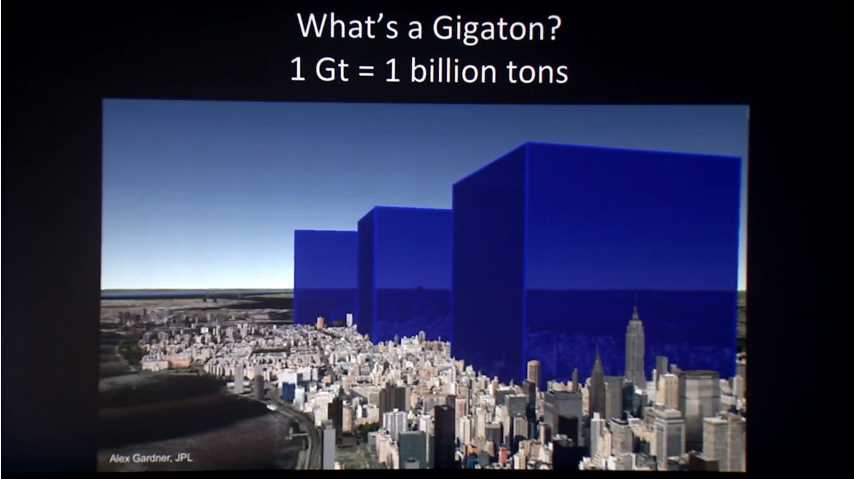
To help with conceptualizing the scales involved, a depiction of 3 one-gigaton blocks of water (or ice) [image credit: Ref. GARDNER]
Similarly, a cube containing a gigaton of slightly denser liquid CO2 would only be fractionally smaller (with sides about 900 meters in length), while a gigaton of ice (less dense) would have sides roughly 1100 meters in length.
To further help put this into perspective, from the emissions graph shown above you can calculate that we have been responsible for adding about 2100 gigatons of C02 (GtCO2) into the atmosphere since 1850 (each square in the graph contributes 100 gigatons). That’s about the same weight as icy Mount Denali (formerly Mount McKinley), which climbs to 6300 meters above the Alaskan landscape.
If you begin stacking those gigaton blocks in your head you’ll likely come to the conclusion that the release of 40 gigatons of CO2 every year is a mind-numbingly large quantity of emissions. Especially if we should be tasked to store them rather than send them up into the sky as we have been doing since the dawn of the age of industry.
But if we are to have any chance of slowing down the global warming trend, store them is exactly what we will have to do. In fact, it will turn out we have to do a lot better than that. To have any chance of averting climate catastrophe in the coming decades we are going to have to retrieve a lot of what we have put up there, though we currently have no idea how we will pull this off at the scale required (we will likely need to pull down hundreds of gigatons).
SCIENTIST: Not a bad argument for the decades prior to about 1970. Solar activity actually WAS increasing for a period. But then sunspot activity went into decline, right at the point that average global temperatures began to shoot up. Sunspot activity continued to fall for the next half century while both CO2 concentrations and average global temperatures continued to climb…
It is tempting to explain away global warming as a result of natural influences over which we have no control. But try as they might, when scientists model climate they are only able to reproduce to a good approximation the observed temperature rise when they factor in the contribution due to fossil fuel emissions.
The graph below, typical of computer-modeled simulations of average global temperature evolution, show the results when only (natural cause) solar activity and volcanic activity are added to climate models (blue curve), and when fossil fuel-burning emissions (carbon dioxide and sulphates) are also included (red curve). Note that sulphates lower temperature because they reflect incoming sunlight, as in general does volcanic activity (when it generates atmospheric sulphates). Carbon dioxide only drives up the temperature because it traps the outgoing infrared energy of the Earth.
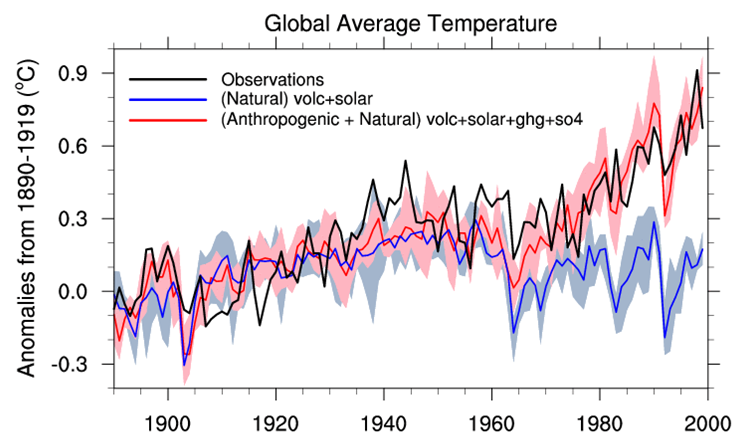
Computer modeled combinations of natural and anthropogenic (human-driven) climate forcings over the span of the twentieth century. Shaded areas represent the uncertainty in the results of the simulations. [image credit: Ref. MEEHL]
You can see that natural forcings (sun and volcanoes) absolutely fail to reproduce the trend of observed global warming during the latter half of the twentieth century (black curve). Their effects on global warming are either puny (sun) or temporary (volcanoes – note the big dip around 1991 when Mount Pinatubo erupted in spectacular fashion). But when the effects of fossil fuel emissions are taken into account the change in average global temperature which comes out of the simulation is in close agreement with observations.
The fact that we can model climate according to the known laws of physics and get the simulations to agree with what we see out in the real world is strong evidence that we have a handle on the underlying cause of global warming (I am showing you a graph or two in this article, but in reality we have half a century’s worth of work in this area and it all points in the same direction – which is that greenhouse gases are responsible for the warming of the Earth’s atmosphere and oceans).
Fantastic, you declare. So if we know for sure it is the burning of fossil fuels that is the cause of global warming we can just switch over to renewable sources of energy (like solar and wind turbines) and the crisis will be over. Temperatures will stop rising. Right?
Unfortunately, no.
Putting aside the fact that it would take decades to switch to a new world-wide renewable energy source infrastructure, if we were to stop contributing to the build up in greenhouse gases the temperature would still keep going up for some time before tapering off.
Here’s one way to understand why that is. Because we have put so much in the way of greenhouse gases into the atmosphere the infrared component of Earth’s energy signature (it’s outgoing energy) is largely blocked from leaving the planet. To an observer stationed well beyond the upper limits of the atmosphere our Earth would appear to have “cooled down”. The needle on his energy flux device just would not register as much of that infrared energy as it once used to do. Before rising temperatures can stabilize the planet must continue to warm until it reaches a temperature at which its (now increased) energy emissions to outer space once again balance the incoming energy it is receiving from the Sun.
That will take a while, in part because it requires the oceans to heat up enough that as much energy flows out of them as is flowing in. It may take as much as a thousand years for complete energy equilibrium to be established, but in the short term (for the next several decades) the average global temperature will continue to rise rapidly until the surface temperature of the oceans approximately equilibriate with the air above them.
Fortunately, most of the heat energy so far generated by the extra planetary warming has gone into the ocean – a full 93 percent of it. If it was not for that capture of heat by the ocean the increase in average global temperature due to the greenhouse effect would be FAR greater than has been observed. As simple calculation based on the notion that the molecular energy of a gas scales in proportion to the absolute temperature would suggest that if ALL the energy had remained in the atmosphere it would be warmer (on average) than it is now by about 12 degrees Celsius. We would have all perished decades ago, along with most life on Earth.
The huge inertia of the ocean to heating effects, although it has so far saved our bacon, could also one day prove to be our downfall. The waters of the ocean turn over on a timescale of centuries. Heat that makes its way down will one day make it back up to the surface. Or visit the Antarctic oceans and hasten the melting of the ice sheets. Depending on how much heat has been sequestered in the years ahead, it could spell disaster for any far off civilization that makes it through the current crisis.
At any rate, we are stuck with rising temperatures for at least the next several decades and must endure whatever comes of it.
If there should be any doubt that global warming is occurring, to be convinced one only has to look at the incredible amount of heat that has accrued in the ocean in the past half century (it is a staggering 25 times 1022 joules).
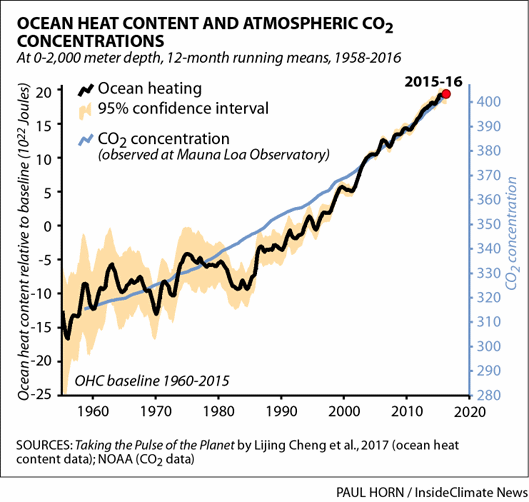
Since 1980 the oceans have absorbed about 250 billion trillion joules of energy. Enough to power the current energy needs of the world for the next 5 centuries [image credit: Ref. OCEAN]
Hopefully at this point we can put to rest any doubts about whether or not global warming is happening, or what the cause of it might be. But unless you are still wondering I’d make one final observation about whether or not we can be confident in ascribing the cause of the warming to human-derived greenhouse gas emissions.
We know the bulk of the carbon dioxide excess in the atmosphere was put there by us (and not some other natural event like decaying permafrost). We know this because we can “fingerprint” the carbon by looking at the concentration of the different atomic isotopes that make up the gases of the atmosphere. We can track those carbon dioxide molecules back to their source, and the source is us.
The ONLY warming mechanism that consistently reproduces the observations of rising average global temperature is the one that Gilbert Plass proposed in the 1950s – greenhouse gases created by man.
Planetary Warming – What Does The Historical Record Tell Us?
If we accept the planet really is warming up and we have a reasonable handle on the science behind it, is this something we should truly be concerned about? After all, we know the planet has warmed and cooled repeatedly in the past. Isn’t this basically a natural phenomenon?
Skeptics of climate change take great comfort from being able to point out the climate has changed in the past, with temperatures sometimes rising significantly. This is true, but never in the presence of humankind. It’s not uncommon for a skeptic to put up a temperature plot for the last few thousand years and claim that the temperature has “swung wildly” in that time frame.
Let’s have a closer look at this claim. Below is a plot of two independent reconstructions of the global temperature record for the last two thousand years (up to 2013). We are going to start with this short time window, then expand it backwards.
The green dots, from the Past Global Changes program (PAGES), represent continental (land) temperatures estimated from examining “511 climate archives from around the world, from sediments, ice cores, tree rings, corals, stalagmites, pollen or historical documents and measurements” [Ref. PAGES]. The blue line, the Marcott data, represents estimates of temperatures derived from deep sea sediments.
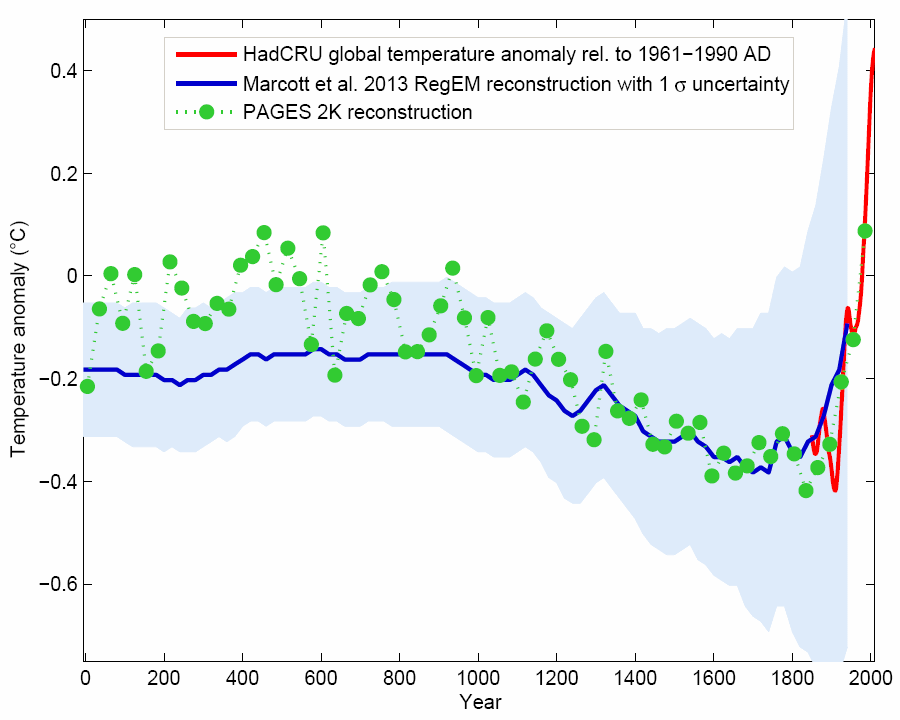
Reconstructions through fossil records of the temperature record for the last 2000 years (blue and green) plus recent direct measurements (red) [image credit: Ref. MARCOTT1]
To within the estimated accuracy of the latter measurements (light blue shaded band) the two sets of data are in close agreement. They show, excluding the rise in the last century, that average global temperature has fluctuated about 0.2 degrees Celsius.
If we extend this time frame back another 10,000 years (see following graph) the temperature variation is greater still [Ref. MARCOTT2]. It appears to have swung as much as 0.7 degrees Celsius. Surely then, the rise of about 1.2 degrees Celsius since pre-industrial times is within the realm of possibility due to nothing more than a statistical fluctuation. One that might well correct itself given a sufficiently long time frame. So contends the climate change skeptic.
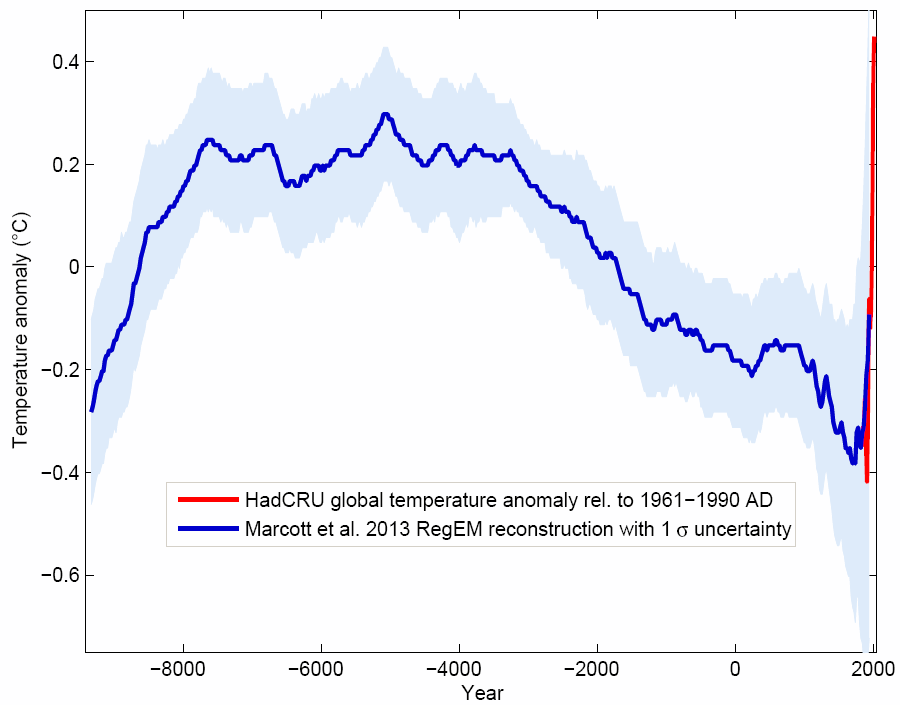
Extension of the reconstructed temperature record (from sediment drilling in the deep sea, corals, and ice cores) to 12,000 years. Compare far right of this graph with the preceding one [image credit: Ref. MARCOTT1]
There are at least two very good reasons for thinking this is NOT the case.
The first has to do with the rate and projected magnitude of the swing we are now witnessing.
For the past 10,000 or so years the temperature has remained remarkably stable, never leaving that narrow range of about 0.7 degrees Celsius. That period allowed for the development of human agriculture, metal-working, and then the rise of the first large-scale civilizations. We got the Sumerians and the first written language, the Egyptians and their pyramids, the Chinese dynasties, the Minoans, dozens of cultures that began exploding across the world and significant enough in size and duration to leave their mark. All because the temperature remained in a relatively stable range conducive to consistent annual crop yields and sea level neither rose nor fell, allowing for coastal cities to take root and flourish (more on the dependence of this fact on average global temperature later).
But according to climate scientists we may see a temperature rise in the next few decades of as much as 3 to 6 degrees Celsius. We will be going where neither agriculture nor human beings have ever gone before. And compared to the 5,000 year interval between the stabilization of the temperature and the appearance of the first agriculturally-driven mass societies, we’ll be doing it in the relative blink of an eye. We have no record of the climate changing this rapidly for at least the last 10,000 years, and possibly the last million or so years (the duration over which ice ages have come and gone).
The second reason for thinking the recent temperature changes represent something far from a natural anomaly comes from considering the reconstructed temperature record out to 20,000 years, back to the end of the last ice age.
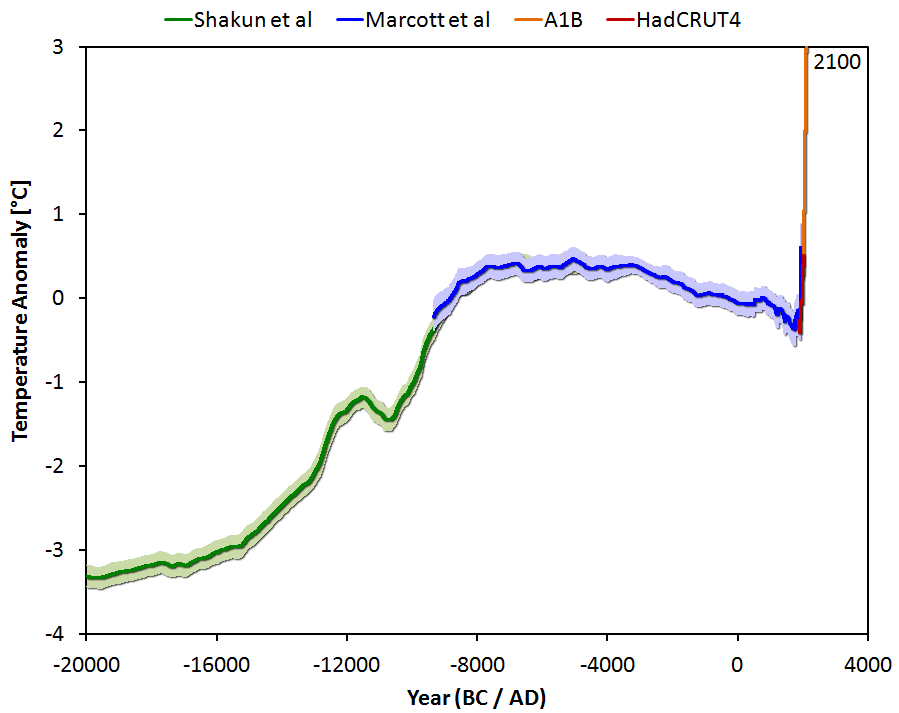
Temperature reconstruction for the last 20,000 years showing transition out of the last ice age. The orange A1B temperature projection corresponds to a “business as usual” high C02 emissions scenario [image credit: Ref. MARCOTT1]
Now it becomes apparent that the temperature fluctuations of the last 10,000 years are minor in comparison to the millenia scale changes. Also that the “fluctuations” of the last 2,000 years are less fluctuations than bendings to a trend. The shape of the temperature curve is characteristic of the final stage of all ice ages, each of which spans a period of roughly 100,000 years. The final millenia of ice ages all show a general rise in temperature of about 4 or 5 degrees Celsius, followed by a slow cooling phase that lasts until the temperature has dropped back down by the same amount, initiating the next cycle of rapid thaw and slow refreeze.
It becomes apparent on re-examining these curves that currently we should be on the slope of a gently cooling climate, slowly headed towards the next ice age in the space of a few tens of thousands of years. Instead, we have completely erased the natural cycle of climate variability (due to variations in the orbit of the Earth around the Sun and the tilt of its axis of rotation) and now we are driving the temperature of the planet in the opposite direction at great speed.
There is nothing natural about the sharp upturn seen in the temperature graph shown above.
Let’s follow this trend of zooming out to greater time scales and this time look back as far as 800,000 years to see the saw-tooth pattern of rising and plunging global temperatures that characterize each of the ice age periods of roughly 100,000 years:
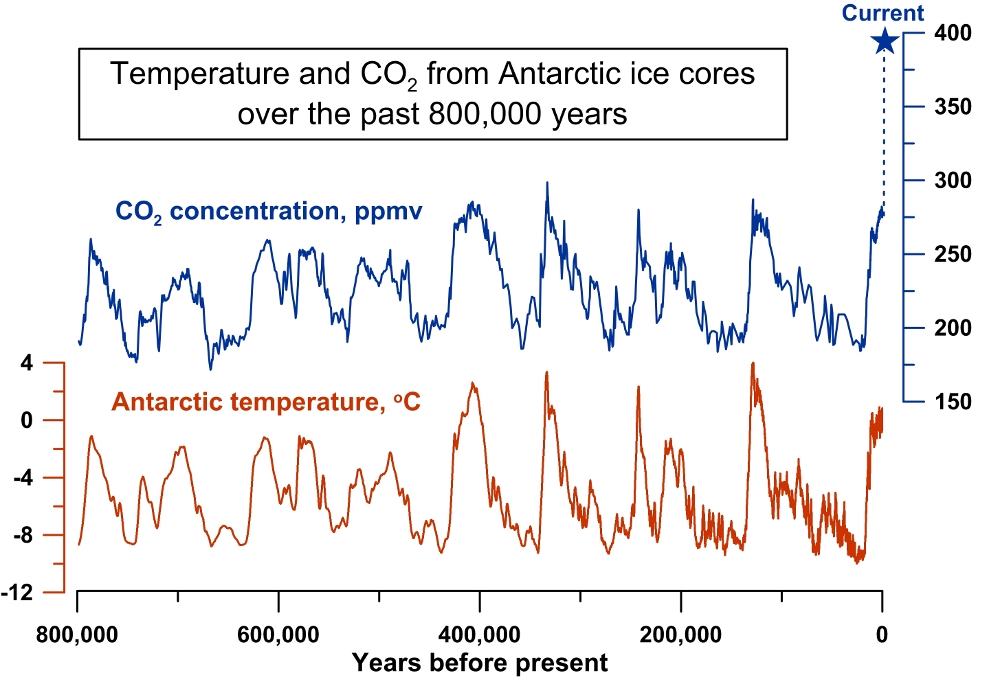
Temperature changes in the Antarctic are about twice as great as global changes. So a swing of 8 degrees locally corresponds to an average global temperature change of 4 degrees.
It is evident from the graph that temperature and carbon dioxide levels have closely tracked each other for at least the last eight ice ages. This record, taken from ice cores drilled into the Antarctic ice sheet leave no doubt of some kind of definite causal relationship. When C02 levels go up, it appears temperature goes up too…
SCIENTIST: Well, you have it half right. The temperature in the Antarctic region DID go up ahead of the increase in carbon dioxide levels. As you rightly suspect, it was the CAUSE of those emissions. But this observation does not prove that globally (the world over) the temperature drove the rise in C02 concentration. In fact, it was the other way around. Ice ages end when rising CO2 levels cause the planet to warm and melt ice across the world (see below for details).
Our doubting friend is correct about the finer details of the correlation between temperature and C02 levels.
When scientists looked closely at these records it did indeed appear that each rise in temperature in the Antarctic was FOLLOWED very shortly by a rise in carbon dioxide around the world.
Did that mean the theories of Arrhenius and Plass were incorrect? Does carbon dioxide not actually drive the average global temperature?
A team of climate science modelers suspected the established science would turn out to be correct when all the evidence was collected. So they decided to run an exceedingly sophisticated computer model of the period covering the end of the last ice age [Refs. SIM1,SIM2]. They included the interactions of all the physical entities across the globe which drive climate – the atmosphere, the oceans, the land masses and the ice sheets – and used as input the initial conditions determined by looking at the reconstructed temperature and C02 records determined from ice cores and oceans and lake sediments representative of the period.
They ran their simulation, modeling 15,000 years of ice age evolution, for a full 3 years on one of the most powerful supercomputers available in 2009. And after 14 million processor hours they had their answer.
In graphical form it looks something like the following (the interpretation of which I’ll explain in a moment). What it tells us is that the century-old theory of a greenhouse gas-driven climate, backed by more than six decades of computer model simulations [Ref. MODELLING], is still on rock solid footing.
As expected, the model showed it was carbon dioxide that causes global warming. The intuition and mathematical prowess of Arrhenius, Plass and other climate scientists over the years has been borne out.
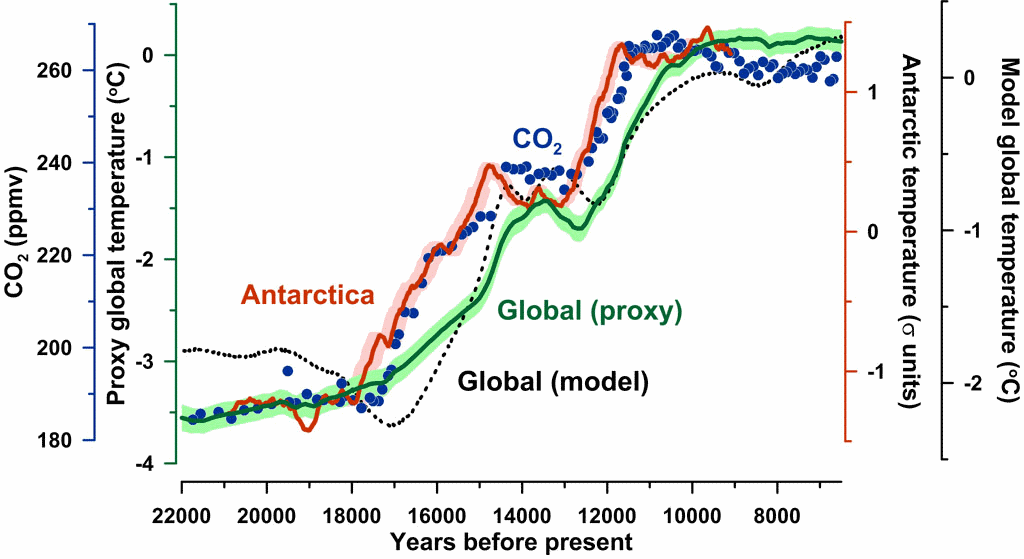
A Jaguar supercomputer simulation carried out at Oak Ridge National Laboratory in 2009 through 2011 showed that carbon dioxide drove global warming at the end of the last ice age. [image credit: Ref. SIM1]
The graphic is a little difficult to interpret, but it is well worth making the effort to understand it – especially if you have ever doubted that climate scientists really have any handle on what is happening with climate.
First, let’s just admit that modeling something as complex as the energy flow of the entire planet is not the least bit trivial. We shouldn’t expect painfully obvious smoking gun signatures to appear as the answers to questions posed about such an intricate system. And yet, the curves on this graphic are as close to “smoking gun” as you are ever likely to see. So let me describe what we are looking at.
The green curve is the average global temperature record reconstructed from paleoclimate data. It corresponds to the same temperature data (also in green) appearing in the 20,000 year record two graphs back. The goal of the modelers was to try to reproduce this temperature record using nothing more than reconstructed carbon dioxide levels (from paleoclimate data) shown as the blue dots.
Also present on the graph, for reference, is the reconstructed temperature record (from paleoclimate data) for Antarctica (in red).
Finally there is the dashed line, the global temperature as determined by the computer modeling. This is the “result” and I will explain the significance of it in a moment.
Skeptics have looked at the red curve (temperature) and the blue dots (CO2) and declared that it shows the temperature rising before the corresponding rise in CO2. They are correct. At key points in the history of the last ice age you can see the temperature clearly increasing before C02 – most evidently at about 17,500 years ago, and 15,000, and 12,000. This is because temperature IS driving the release of CO2.
At least, it is doing so around Antarctica.
The modelers point out that at the very end of an ice age the summers in the Northern Hemisphere become unusually hot. This is due to cyclical changes in the Earth’s orbit around the Sun lasting about 100,000 years. The glaciers in the north begin melting, sending cold fresh water into the Atlantic ocean which inhibits the northward flow of warm water from the southern oceans. This backs up heat in the Antarctic region and causes the Antarctic oceans to become hotter and less able to contain dissolved carbon dioxide which bubbles to the surface of the water and enters the atmosphere.
The newly-released CO2 circles the globe and the entire Earth slowly begins to warm in response to the increased levels of greenhouse gas.
The surprise perhaps is that each time CO2 stabilized in concentration (around 14,000 and 11,000 years ago) it took about 1000 years for the global temperature to also stabilize at a new level. But it turns out there is a very good reason for that. The short answer is the oceans take a very long time to warm up in response to an applied source of heat (more details on this point shortly). The presence of all the ice at the end of an ice age provides yet another clue as to why the temperature rise might have lagged as long as it did.
So the reconstructed records tell us the average global temperature lagged the rise in C02 by centuries. This is very strong historical evidence that greenhouse gases are the CAUSE of global warming.
Moreover, if we look at the results of the computer simulation (the dashed black line) we see that the behavior and magnitude of the average global temperature changes predicted by the model match fairly well the historical record (the green curve).
Where the historical temperature record stabilizes, so too does the simulation. Where it rises significantly, so too does the simulation, at about the same time. By no means is it a perfect match. But considering the enormous complexity of the model the agreement between the prediction and the historical record is very compelling.
Carbon dioxide acts as a greenhouse gas and drives the average global temperature.
The next time you come across a climate skeptic who tells you climate scientists have little understanding of the physics of climate change, keep in mind this 14 million hour computer simulation and the result which came out of it. Besides all the blood, sweat and tears university researchers put into developing a robust and comprehensive model which could withstand international scrutiny, the simulation also cost a pretty penny to run. It never would have received funding if the National Science Foundation (NSF), the Department of Energy (DOE), and the National Aeronautics and Space Administration (NASA) did not believe their money was being well spent [Ref. SIM1].
In short, the majority of climate scientists are not bumpkins. The work they perform is very precise, is carried out with the utmost care and regard for the seriousness of the governmental policy decisions that may one day be based upon its predictions, and they have absolutely no desire to be associated with misleading claims about the results of their research. When potentially their lives, and even more so the lives of their children depend on these pronunciations, they try damned hard to come up with the right answer.
Drivers Of Planetary Temperature – Fast And Slow Time Scales
We study the historical temperature records for clues as to how global warming may play out in the years ahead. I would be attempting to sweep under the rug the enormous complexity of climate change science if I said it was easy to infer future warming trends by looking at the past data.
On the other hand, if we are willing to accept that someone has already done the hard work of figuring out how to use the past data to predict roughly how the future will shape up there IS a relatively straight forward way to “see” the bigger picture. I will use this section to expand upon that idea.
In our simplified model of the world we can picture TWO main driving forces that control climate change.
One causes relatively RAPID responses in the environment and results in temperature changes which occur within a period of several years to a few decades. It is the spatial differential between temperatures of large bodies of air and water that drive all the extreme weather events that get our attention in the short term, but it is the overall change in termperature from decade to decade, century to century, that matters most to us. So we concentrate on temperature when talking about climate change, knowing that ultimately this is what drives the extreme weather events that could upend the world as we know it.
The other driving force is a SLOW response which can take several centuries, or even millenia, to push the temperature in one direction or another.
Greenhouse gases fall into the category of RAPID response drivers. Others include aerosols due to volcanic eruptions, water vapor, clouds and sea ice (which waxes and wanes seasonally).
As an example of a rapid climate response scenario you can imagine a sudden massive volcanic eruption that spews millions of tons of sulphur dioxide (SO2) into the atmosphere. SO2 combines with water and air to form sulphuric acid which reflects a portion of sunlight back into space before it can interact with the surface of the Earth and warm it. This causes a global cooling effect as the SO2 spreads widely in the atmosphere – a cooling that can last for several years.
Oceans, and ice sheets which sit on land masses (like the ice over Greenland and Antarctica), are the prototypic SLOW response drivers. Oceans can take centuries to mix heat into their depths. Ice sheets can take up to thousands of years to melt, and tens of thousands of years to form.
You can begin to appreciate the kind of time scales involved due to the thermal inertia of the oceans by looking at a graph showing the (simulated) average global temperature response due to an instantaneous doubling of the amount of greenhouse gases in the atmosphere (a rapid driver). In this case the climate model assumes that other (non-ocean) slow response environmental factors remain essentially unchanged over time (for example, the ice sheets do not melt).
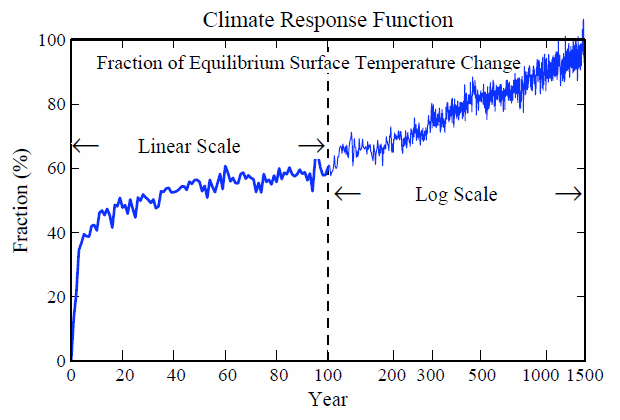
The “C02-doubling” temperature response shown here is based on a 3000-year climate simulation. The time scale is compressed in the right-hand half of the graph [image credit: Ref. HANSEN2008]
This exercise, of doubling the C02 concentration and seeing how much the temperature of the system (Earth) changes, is known as the climate sensitivity problem. The question being, how sensitive is climate to the presence of CO2 in the atmosphere?
The ultimate amount of warming depends on the dynamics of the model and the strength of the various parameters used to quantify them. In the graph above the ultimate temperature change is not shown because here only the nature of the response of the system over time is of interest – the time scales.
In this case, and it is typical of realistic climate models with a combination of RAPID and SLOW response drivers, you can see from the graph how it takes more than a thousand years for the equilibrium (stabilized) average global temperature to be achieved. At the other end of the scale, within just a few years, about 40 percent of the warming is achieved, about 50 percent within the first 40 years, and about 60 percent within 100 years.
It is the slow mixing of heat into the layers of the ocean on the time scale of a century or more – and in more realistic models involving millenia-scale melting of the ice sheets and other slow drivers – that allows one to think about the overall warming process as dividing into two parts: the RAPID response that gives half the warming within about 40 years, and the SLOW response that completes the process on a time scale of a millenia or more.
The distinction between RAPID and SLOW is not likely to seem all that important or consequential for a planet in energy equilibrium (as has been the case for most of Earth’s history). This is because, in a state maintained in near equilibrium, changes in energy flux take place at a rate slower than the system is able to adjust itself so as to restore the energy balance and remain in equilibrium.
It is only when a sudden and large change in energy flux takes place (for example, a drop in solar radiation due to a large sulphur dioxide plume from a volcano, or an increase in greenhouse gas warming caused by a massive release of methane from the bottom of the ocean) that RAPID and SLOW responses need to be distinguished to understand how the system will fully respond.
This last point is important because essentially what we have done in the last century and a half is introduce a HUGE influx into the atmosphere of a RAPID driver of global warming (carbon dioxide emissions). This has short-term AND long-term warming implications, both of which need to be addressed.
But before you can figure out what those implications might be you first need to calibrate in some sense the climate response of RAPID and SLOW drivers.

Dr. James Hansen has warned of the extreme perils of climate change to humanity since the late 1980s.
This is what Dr. James Hansen, Adjunct Professor at Columbia University’s Earth Institute, and his colleagues set out to do using paleoclimate records to determine the effects of fast and slow drivers of climate during the last 400 thousand years – a time period long enough for the Earth to have cycled through four ice ages.
The key to understanding the analysis is that throughout most of that period the Earth was never far from energy equilibrium. In this case the underlying theory describing a system in thermodynamic equilibrium tells us the change in the equilibrium temperature due to applied sources of heat is directly proportional to the sum of those heating effects (forcings). In plain math:
The term ΔF, the applied heating effect, is known as a “radiative forcing” in climate science because it always derives from energy coming or going as electromagnetic radiation (incoming sunlight, or outgoing infrared).
ΔT is the change in the average global temperature caused by the radiative forcing after equilibrium has been restored, and λ is the proportionality constant measured in degrees Celsius per watt per square meter ( oC W-1m2 ). Equilibrium is restored when the radiative forcing returns to zero.
Hansen’s team looked at the temperature record for the Antarctic going back 400 thousand years, and attempted to relate the temperature to the dominant radiative forcings throughout that period.
One of these was the RAPID forcing responsible for causing each of the ice ages to come to a relatively abrupt end. It has as its origin a periodicity in the Earth’s orbit around the Sun (and the tilt of Earth’s axis of rotation) that causes an increased amount of sunlight to warm the Northern Hemisphere during the spring for a period of several thousand years. This happens roughly once every 100,000 years, the last time occurring between about 18,000 and 11,000 years ago.
It was at these times, every spring, while the Earth was significantly out of energy equilibrium that the planet was repeatedly nudged to make a transition from deep freeze to thawed state. These short RAPID injections of heat into the top of the planet (which produced copious ice-sheet meltwater in the Northern Hemisphere) eventually caused the oceans in the Southern Hemisphere to warm and release CO2. This secondary much SLOWER process, occurring on a time scale of thousands of years, kicked the warming of the atmosphere into high gear.
In turn, the most vulnerable ice sheets (the Laurentide over North America and the Eurasian covering Scandinavia and the British Isles) melted and the planet finally reached a new equilibrium state with the average global temperature stabilized about 5 degrees Celsius warmer than the coldest days of the ice age.
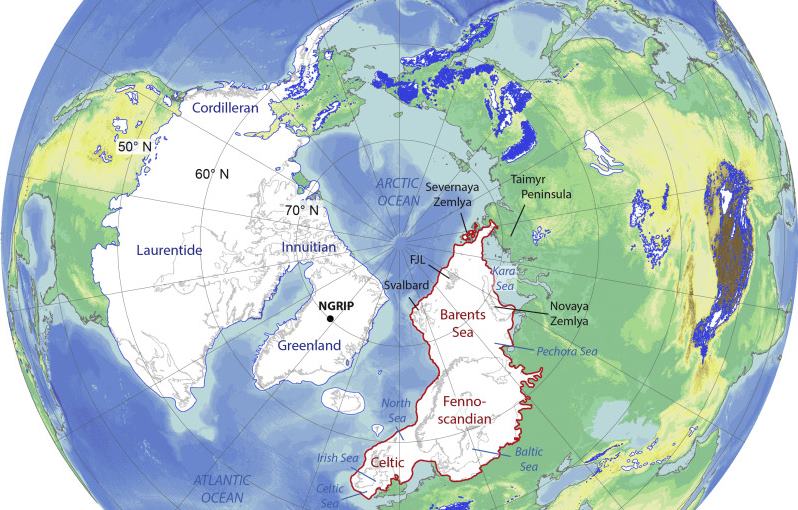
The Laurentide (North American) and Eurasian (outlined in red) ice sheets reflected away a portion of the Sun’s warming influence during the last ice age [image credit: Ref. EURASIAN]
All throughout this period the processes responsible for SLOW climate change left traces of their influence in the paleoclimate record, as did the RAPID influence of spring heating that kick started the process. But it was the SLOW causes of temperature change that, by far, drove the change of climate.
It was the slow release from the ocean of the greenhouse gases carbon dioxide and methane that raised the temperature enough to cause the ice sheets to begin to melt.
By examining concentrations of these trace greenhouse gases in bubbles collected from ice cores drilled from the Antarctic one can get a record of atmospheric carbon dioxide and methane concentrations going back at least twice the period of time studied by Hansen’s team.
The other radiative forcing (or the absence of it) which caused the temperature to rise was due to the reflectivity of all the sea ice and land surface ice sheets present throughout these periods. More ice means more reflected sunlight, and less radiative forcing. By looking at sea level records determined by sediment cores taken from the Red Sea it was possible to infer how much ice existed based on how far the surface of the oceans had dropped over the same period (evaporated ocean water turns into snow over the land, reducing the amount of water remaining in the oceans).
Because large amounts of ice (like ice sheets over the Canadian and North American land masses) take a very long time to form (and melt), ice sheets can be thought of as SLOW forcings of the climate.
Both RAPID and SLOW radiative forcings are measured in watts per square meter. They express how much energy per unit area over the surface of the Earth is going into heating the planet.
Depending on where you set your reference value, these radiative forcings can be positive (causes heating) or negative (causes cooling). Compared to today (our reference point) radiative forcings throughout an ice age are negative (less greenhouse gases to warm the planet, less sunlight getting past all the reflective ice).
By calculating the sum of the RAPID (seasonal/orbital) and SLOW (gradually changing greenhouse gas concentration and reflective ice) radiative forcings Hansen knew that it should be possible to calculate the expected equilibrium temperature of the planet for the entire history of the ice ages and then compare that with the observed (indirectly measured) temperature to see if they agreed. If they did, it would be strong evidence that our understanding of climate dynamics is on solid footing.
The RAPID forcing turns out to be small in comparison to the SLOW forcings, so it is ignored in Hansen’s calculation of the equilibrium temperature.
This was arrived at by figuring out the sum of the radiative forcings for the greenhouse gases and the ice sheets, and then dividing by the proportionality constant λ.
You can see the result of Hansen’s calculations in the following graphs (explained on the other side):
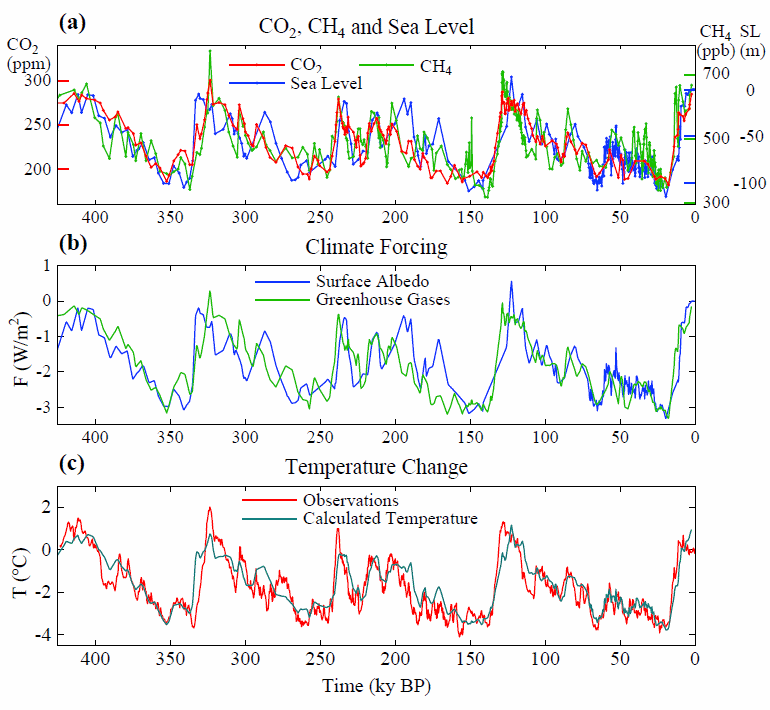
Bottom graph: a calculation of the expected change in global temperature based on greenhouse gas concentrations (top graph) and reflective ice (albedo shown in middle graph) for the last four ice ages [image credit: Ref. HANSEN2008]
How do we decipher what’s going on in these graphs?
It’s perhaps simpler than it appears.
In the top graph we see concentrations of the greenhouse gases – carbon dioxide and methane (red and green curves). From these Hansen calculates the radiative forcing, or heating per unit area (green curve in second graph). It’s negative for all periods deep into an ice age because those gases were present in lower concentrations than they are today. For example, CO2 concentration has been as low as 200 ppm during the coldest part of an ice age (today it’s above 400 ppm).
We also see the reconstructed sea level in the top graph (blue curve). The lower the sea level, the more frozen water is bound up in the ice sheets covering the North American and European continents, and the larger is the amount of sunlight that never makes it to the surface of the Earth to warm it. This albedo-derived forcing (blue curve in second graph) is in almost one-to-one correspondence with the drop in sea level.
By summing the two radiative forcings in the second graph and asking what is the forcing-to-temperature conversion factor λ needed to best scale the calculated temperature (grey curve in lower graph) to the independently reconstructed Antarctica temperature record (red curve) Hansen comes up with the following value:
This expression for λ says that for every extra one watt per square meter of radiative forcing applied to the planet the equilibrium average global temperature will rise by 3/4 of a degree Celsius. Or to say it another way, a radiative forcing of 4 watts per square meter will result in a temperature increase of 3 degrees Celsius.
You can see that the final calculated temperature in the third graph shown above is in very good agreement with the indirectly determined temperature.
This latter (reconstructed) temperature record is based on ice-core measurements of oxygen-18, an isotope of oxygen whose concentration in the water molecules of ice is highly correlated with average local temperature of the surface of the ocean (and thus the air above it). In this case local refers to the region of the Antarctic.
Should we expect the reconstructed (actual) temperature record and the calculated equilibrium temperature to agree as well as they do?
Only if the theory behind climate change, one based on the notion that greenhouse gases are a major driver of climate change, is correct.
Even then the close agreement, given the relatively few parameters that went into determining the temperature on the basis of concentrations of trace greenhouse gases and reflective ice sheets (sea level drop) is fairly remarkable.
Hansen has said of this agreement between theory and measurement:
The remarkable coincidence of calculated and observed temperatures cannot be accidental. The close agreement has dramatic implications for interpretation of past climate change and for expectation of future climate change due to human-made climate forcings. [Ref. HANSEN2007]
What he means by this is the following.
You can take the derived value of λ and now ask what it implies for the climate sensitivity problem. If you double the concentration of C02 in the atmosphere, so as to trap more outgoing long wave radiation from the surface of the Earth, by how much does the temperature of the atmosphere rise?
Given our copious burning of fossil fuels since the dawn of the industrial age the answer to this question is going to reveal how long we have left before we can expect serious climatic consequences.
Someone has already calculated the radiative forcing for a doubling of CO2 in the atmosphere. The commonly accepted value is around 3.7 watts per square meter.
Multiplying this figure by Hansen’s nominal value of 3/4 oC square meters per watt gives an average global temperature increase of around 2.8 oC.
So if we were to double the pre-industrial concentration of CO2 from 280 ppm to 560 ppm we would tentatively expect the average global temperature to rise by 2.8 degrees Celsius. About half of this would happen in the first few decades and the rest would follow within a time span approaching 1000 years.
But we know from the Antarctica temperature records that in addition to greenhouse gas forcings ice sheet forcings also played a part in changes of the equilibrium temperature. And of a comparable size.
Because plenty of ice remains on the surfaces of Greenland and Antarctica, their continued melting and disintegration should lead to an additional 2.8 or so degrees of eventual warming, for a total of 5.6 degrees Celsius (about 4.5 degrees Celsius hotter than today).
Remember, this is assuming we simply double the concentration of C02 from pre-industrial and take it to 560 ppm (today in 2018 we are at 410 ppm).
This expected change in average global temperature can probably be assumed to include the effect of the radiative forcing due to the melting of sea ice in the Arctic (see the next section) but not extra forcings due to the release of additional greenhouse gases from increased incidence of wildfires, thawing of permafrost in the far north, or methane releases in warming oceans.
Assuming we hold constant the current rate at which we are emitting carbon dioxide into the atmosphere we will be at 560 ppm by the year 2080.
Just to confirm this implies a world eventually ice-free, with both the Greenland and Antarctic ice sheets fully melted, the concentration of CO2 in the atmosphere when the Antarctic ice sheet formed 14 million years ago was just 450 ppm.
We are currently on target to pass that atmospheric CO2 concentration by the year 2035.
Life On An Ice-Free Planet Earth
What might the world look like eventually if we go on burning fossil fuels, carbon dioxide levels keep rising, and the average global temperature rises to 4 or 5 degrees Celsius above pre-industrial times?
Four to five degrees is about the difference between where we are now and the last ice age. In terms of climate it represents a vast gulf.
Because of this it’s probably not too far from the truth to speculate that in a 5 degree world fire would be almost as common an occurrence in the currently forested areas of the new world as ice and snow was in the last one.
In July of 2018 as I was writing this article the thermometer outside my apartment reached 46 degrees Celsius. This was 11 degrees higher than the average for this time of the year.
Much of the Northern Hemisphere was experiencing a lingering heat wave.
To the north, dozens of large-scale fires were burning on the Western forested landscapes of the United States. Likewise in the northern forests of East Siberia bordering the Arctic Circle, where much colder weather is expected, a heat wave with temperatures surpassing 35 degrees Celsius was fueling massive wildfires.
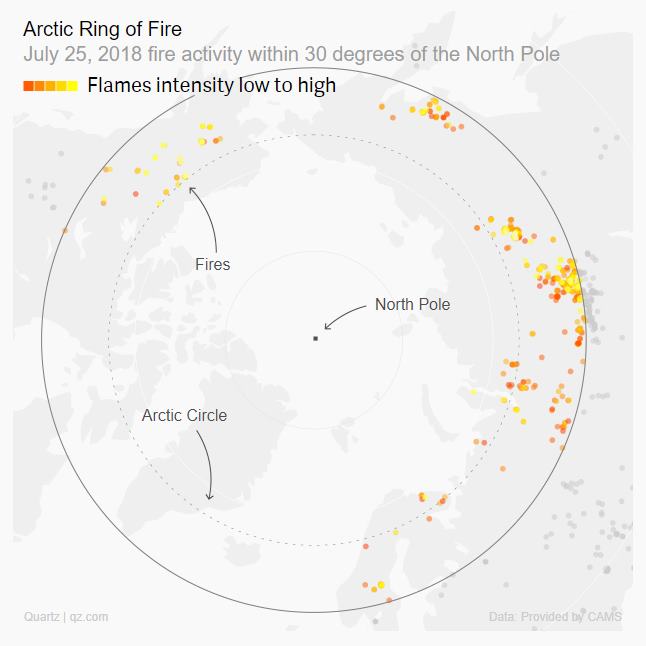
To close for comfort. Each dot represents a wildfire in an Arctic region containing permafrost vulnerable to thawing and the release of greenhouse gases from long-buried organic matter [image credit: Ref. ARCTICFIRES]
In Sweden the heatwave caused wildfires that burned more than 10 times the area of land they normally would during summer.
This kind of extreme climate behavior is representative of a world barely 1.1 degrees Celsius above pre-industrial. It may be sporadic behavior, but it will become increasingly more frequent in the years ahead as the average global temperature continues to rise. Baking heat, drought, year-round fire season.
Whatever lies ahead for us, you can bet we have absolutely no appreciation of what it will mean to live in a 5 degree Celsius world.
How could we? The last time it was that hot on this planet was 14 million years ago when the world was ice-free.
Impending Loss of Antarctic and Greenland Ice Sheets
The massive ice sheets of Antarctica had by that stage already formed once 20 million years earlier still, then they thawed out for a period of millions of years when CO2 levels rose once again, then finally they settled into a permanent frozen state which has existed until today.
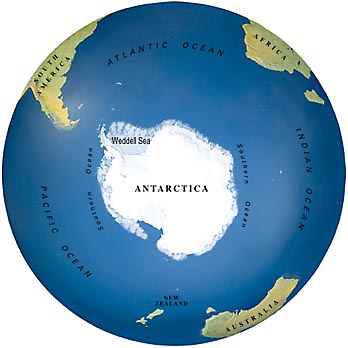
The Antarctic ice sheet at the bottom of the world contains about 30 million gigatons of frozen water [image credit: abc.net.au]
To put these timelines into perspective, consider that our remote ancestors stood upright for the first time less than 2 million years before we (homo sapiens) appeared on the scene maybe a quarter million years ago. Throughout our entire history we have mostly known temperatures that ranged from absolutely frigid to mildly tropical. We have never known real heat, the kind that will melt the infrastructure of societies.
Once the Earth settles into its new equilibrium, we can expect a 5 degree Celsius world to again be iceless.
It might take hundreds of years to get to that iceless state. Possibly thousands. We don’t know for certain. What we can say is that when the ice is gone our shorelines will be utterly transformed [Ref. SEALEVEL].
We know this because all the melted ice from Greenland, Antarctica, and all the remaining glaciers of the world, will raise sea level by an estimated 75 meters (250 feet).
We can confirm this astonishing result ourselves by doing a little “back of the envelope” calculation using numbers pulled off an internet search and restricting our calculation to just the largest contributor to the world’s ice (about 90 percent) which is the Antarctic ice sheet.
Our starting parameters for the calculation:
- The Antarctic covers an area roughly 5.4 million square miles
- The oceans of the world cover 140 million square miles
- The average depth of the Antarctic ice sheet is 2160 meters
From these numbers we determine that the oceans of the world cover an area 26 times larger than the Antarctic. Therefore, if the Antarctic ice were spread out evenly over the surface of the ocean its height would be reduced by a factor of 26.
So it’s height would be 2160/26 meters, or 83 meters.
But that’s ice. When Antarctica melts we will be dealing with water which has 90 percent the volume it does as ice. So the final height of the water column would be 0.9 times 83 meters, or about 75 meters. That’s higher than we would expect given we have only included Antarctic ice. But for a rough calculation that does not take into account flooding coastlines it does confirm that the planet would be a significantly different place if all the ice melted.
To accept that we will transition to a 5 degree world is to accept the loss of dozens of our major population centers. London, Paris, Berlin, Stockholm, Amsterdam, St. Petersburg, Rome, Beijing, Shanghai, Tokyo, Boston, New York, Norfolk, Charleston, Houston, Miami, San Francisco, San Diego. These cities, and many more, submerged beneath the rising waters.
Even if we “only” transitioned to a 3 degree Celsius world we would likely be looking at flooding to a depth of several meters, perhaps dozens.
One way to get a better estimate of what we might expect for sea level rise in the decades ahead is to look at the period known (in Europe) as the Eemian, or (in the United States) as the Marine Isotope Stage 5e (MSI 5e). This refers to the peak of the warm period occurring before the last ice age. This peak windows the period of time between about 130,000 years ago and 115,000 years ago.
Paleoclimate researchers have studied fossilized coral reef formations from this period [Ref. HEARTY] and come up with a sea level curve accurate to about one meter:
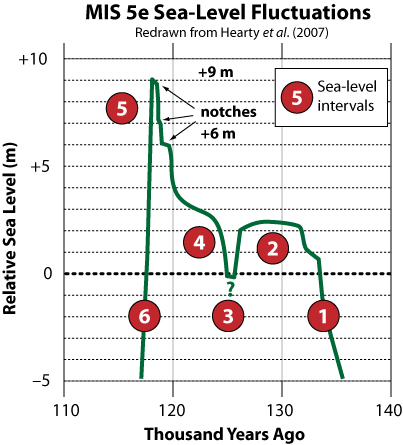
Sea level during the warm period (interglacial) before the last ice age, where average global temperature reached a maximum of about 3 degrees Celsius higher than pre-industrial [image credit: Ref. BROWN3]
In the graph above time increases from right to left as the world emerges from the ice age (interval #1) prior to the last and melting ice-sheets around the planet raise sea level until a point of stabilization is reached around 132,000 years ago (beginning of interval #2).
You can also see from the graph that sea level during the next 14 thousand years rose to as much as 9 meters beyond what it is today (during the short interval #5). The higher sea level (greater ice-sheet melting) suggests the average global temperature was warmer during this period, determined through other studies to be at its peak up to about 3 degrees Celsius beyond pre-industrial temperature. And yet the measured carbon dioxide levels for this time remained about the same as for pre-industrial, at roughly 280 ppm (consistent with no relative warming due to changing greenhouse gas levels).
So what explains the higher temperatures and extra sea water which can only have come from ice melt in Greenland and Antarctica?
The answer is that the higher temperature was the result of an extra radiative forcing due to the roughly 100,000 year long cyclical change in the Earth’s passage around the Sun, and the Earth’s axis of rotation, known as the Milankovitch cycle [Refs. MILAN1,MILAN2,MILAN3]. This is the same forcing that snapped the planet out of the ice age just prior to the Eemian. This solar irradiance, or insolation (or heating), was even larger at its maximum than for the ice age from which we emerged some 12,000 years ago. An excellent five-part discussion of the causes of sea level during the Eemian, written by Earth Sciences advocate Steve Brown, can be found on the Skeptical Science blog [Ref. BROWN1].
The Eemian radiative forcing reached a maximum around 125,000 years ago, then dove to a minimum a few thousand years later, initiating the last ice age.
For a period of about 6 thousand years (interval #2, beginning around 132,000 years ago) sea level remained remarkably stable at about 2.5 meters higher than today, while the temperature hovered at perhaps 1.5 degrees Celsius above pre-industrial. Later the temperature climbed to about 3 degrees Celsius around the 120,000 year mark and sea level shot up to as much as 9 meters higher than today (though could have been as low as 6.6 meters due to tectonic plate uplift – so there’s some wiggle room here on how much ice disappears in the 3 degrees Celsius world [Ref. KOPP]).
The gradual changes in the sea level curve likely represent melting of Greenland and the Antarctic, whereas the sudden changes indicated by “notches” likely mark ice-shelf collapses in West Antarctica, where sea level rose quickly by a meter or more. Both Greenland and the West Antarctic are believed to have contributed at least 2.5 meters worth of sea level rise due to melt/collapse, though not necessarily at the same time [Ref. KOPP].
This coral reef history suggests that if we get close to a 3 degrees Celsius world before the end of this century we might anticipate far greater changes to sea level than what would be expected on the basis of slow melting of ice-sheets (on land) and ice-shelves (in water) which could take centuries. Ice-shelf collapse could add several meters to sea level in a relatively short amount of time and wreak havoc with the shorelines of the world. Coastal cities would be flooded – not necessarily overnight as it takes time for water to redistribute around the globe, but also not on the order of centuries.
This collapse-based projection of sea level rise is a far cry from the maximum estimate of 0.5 to 1.0 meter rise by the year 2100 based on melt projections and thermal sea water expansion. Most estimates of the effects of climate change on the world’s ice reservoirs do not take into account collapse scenarios, just melting.
[NOTE: Greenland’s existence, or more specifically the 2-3 kilometer-thick ice sheet that sits atop it, is something of an anomaly. It represents the only remaining fragment of the Northern Hemisphere ice sheets from the last ice age. It contains approximately 3.3 million gigatons of ice and will disappear from the face of the planet long before the Antarctic ice sheet which holds closer to 26.5 million gigatons of ice. Though the West Antarctic (largely marine ice) will disappear long before Greenland does – before the year 2200 and contributing about 5 meters to sea level rise, if current fossil fuel-burning trends are maintained, according to a 2016 computer simulation of realistic ice-ocean-atmosphere dynamics [Ref. POLLARD]]
Impending Loss of Arctic Sea Ice
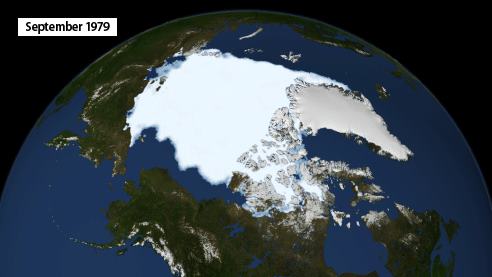
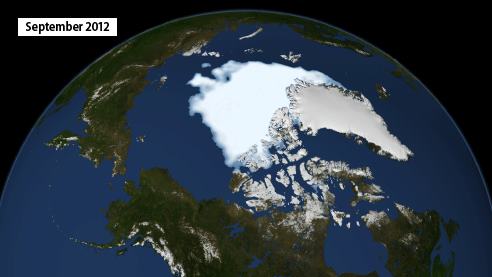
Regardless of the final height of the water column in the decades and centuries ahead, we will feel the effects of the current warming long before the loss of Greenland and Antarctic ice. We will feel it when the sea ice of the Arctic ocean disappears for good sometime within the next couple of decades. Even today polar observers watch the ice anxiously every summer for signs that this year might mark the last one for which some appreciable portion of ice manages to remain solid the entire year round (you may be reading this article and observing to yourself that this “blue ocean” event, where ice is replaced by open water, has already taken place).
In the last few decades Arctic sea ice has retreated from year-round cover, to a summer-time low in September of less than half that amount, and a drop in ice volume by perhaps three quarters. The disappearing north pole sea ice has been one of the most visible signs of impending climate catastrophe.
In 2012 the retreat of summer sea ice was particularly notable, dipping lower in September of that year than any prediction to come out of sea ice loss modeling.
Extent is the term used to describe areas of the Arctic and Antarctic oceans where more than 15 percent of the surface is covered in ice. For the most part it is assumed this “fuzzy” cataloging of the amount of ice cover is only unreliable around the boundaries of the ice sheet.
Until recently the historical record of Arctic sea ice extent was not well known, making it difficult to speculate on just how much recent global temperature increases have been contributing to the shrinkage of the ice. Satellite coverage of the region began in the late 1970s but before that direct measurements of sea ice extent are sparse.
But in 2016 a record was painstakingly reconstructed by Florence Fetterer and colleagues at the National Snow and Ice Data Center [Ref. ICEBRIEF]. They used data collected from various maritime sources going back as far as the year 1850, including ship and aircraft observations, newspaper, diary, and whaling ship log books, and a host of data gathered from institutes that sent observers to study the area over the years.
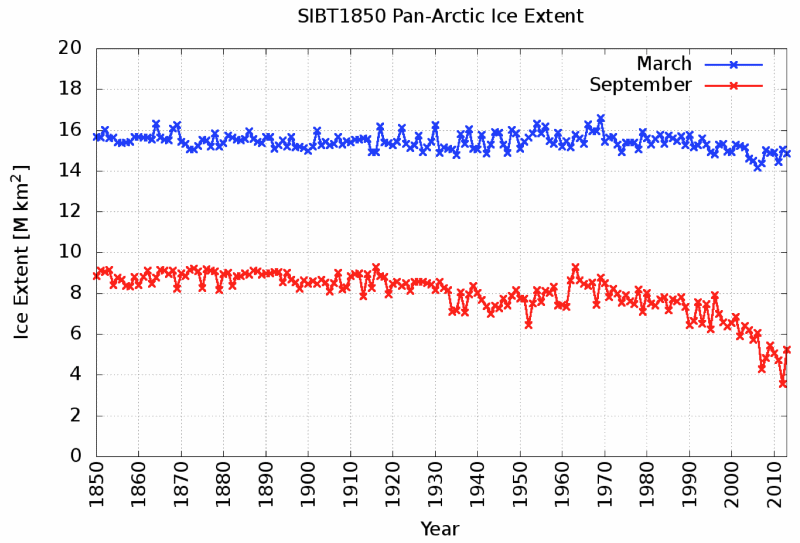
Arctic sea ice extent reconstruction spanning 160 years, from Fetterer et al [image credit: Ref. ICEBRIEF]. Blue curve shows maximum winter extent, red curve shows minimum summer extent.
To the untrained eye this sea ice extent reconstruction may not appear very dramatic. But what it shows is that until about 1930 Arctic summer sea ice had been remarkably stable. Then it began to fluctuate uncharacteristically before entering a shrinking phase from which it has never recovered.
In the years since about 1970, as the planet has warmed, the summer extent has almost halved, and continues to disappear at a rate of about 13 percent per decade.
Computer models predict that summer sea ice extent will bottom out at around 1-2 million square kilometers, down significantly from its pre-industrial value of approximately 9 million square kilometers which it last visited in the 1960s.
According to the models winter ice will disappear too, collapsing suddenly from its relatively stable high-extent values to something closer to the summer time extent numbers. All within the time frame of a few years. This scenario is expected to take place within the next couple of decades.
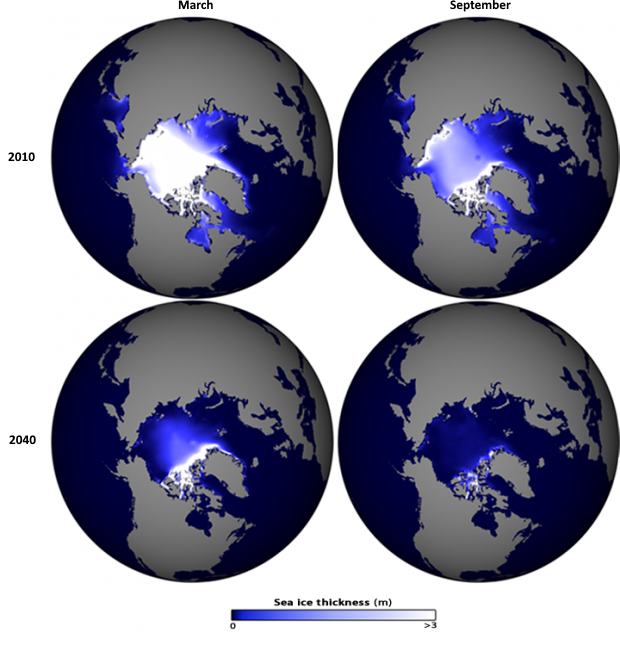
Top pair of globes show Arctic sea ice extent and thickness in 2010, at the end of winter (March) and summer (September). The bottom pair show the projection for 2040, when the Arctic goes mostly ice-free year round – representative of a climate not seen for 3 million years [image credit: Ref. 2040ICE]
When the winter ice disappears the sunlight that had been reflected back into space by the ice for most of the year will be absorbed by the Arctic ocean. Clean, white ice reflects more than 80 percent of the Sun’s light, so that light never gets the chance to warm the Earth. Even dirty ice reflects about 60 percent of the light that falls on it.
But open ocean water absorbs all but about 10 percent. That means 90 percent of the energy of the sunlight is absorbed by the ocean and converted into heat.
This ability of a surface to reflect light is referred to as it’s albedo. The albedo of the Earth as a whole is slightly less than 30 percent, and planetary warming (or cooling) is critically dependent on this value.
Dr. Peter Wadhams, an Arctic sea ice expert with more than four decades of experience, has pointed out that when the Arctic ice is gone the effect on planetary warming due to the change in albedo will be about the same as the effect of all the greenhouse gases released into the atmosphere by man to date. In other words the rate of warming may double.
This is such an alarming observation that it’s worth trying to do a “back of the envelope” calculation to confirm it. I’ll cut to the chase and tell you the figure we’re going to come up with is an increase in the rate of warming of 40 percent due to this effect (not double, but still very significant).
It turns out it’s not a conceptually simple calculation to do. I had to repeat the effort several times, coming at it different ways, before I was reasonably confident I had included the main effects. So take the following result with a grain of salt. My answer for the amount of increased warming could easily be off by a factor of two or so. Nonetheless, the exercise is instructive. It vividly demonstrates the problem.
Let’s begin with the observation that the amount of solar energy falling onto Arctic sea ice in mid summer is about 220 watts per square meter (W/m**2) [Ref. ARCTICSUN]. Let’s reduce this by a factor of two to account for the fact that half the year the Arctic is in darkness. This gives 110 W/m**2 as the average strength of the Sun as a warming influence in the Arctic.
If we assume the average albedo of ice is about 70 percent, and that it is replaced by 10 percent when the ice melts [Ref. ARCTICSUN], then the increase in energy absorbed into the ocean is equal to the fractional reduction in albedo, which is 0.6, times 110 W/m**2 – or 66 W/m**2.
If summer sea ice extent ultimately falls from 9 million to 2 million square kilometers the difference in the area of exposed Arctic ocean will be roughly 7 million square kilometers. In comparison, the surface area of the Earth is 510 million square kilometers.
So the ratio of the two areas is 510/7 or abut 73. Let’s divide our estimate of the increase in energy per unit area by this ratio to get the average global increase in radiant energy due to the loss of reflective Arctic sea ice.
It comes out to 66/73 W/m**2, or 0.9 watts per square meter.
Currently the accepted rate of excess heating due to all anthropogenic (man-made) factors, including greenhouse gases released into the atmosphere since the beginning of the industrial age, is in the vicinity of 2.3 watts per square meter [Ref. RADFORCE]. This number also takes into account the effect of “anti-greenhouse” gases, like aerosols that act to cool the planet rather than warm it (sulphur dioxide being one of the best known of these gases).
In other words our very rough calculation came up with an extra melted sea ice planetary warming contribution roughly FORTY PERCENT as large as the currently accepted global warming figure due to all other factors. Because we have ignored the reduction of albedo on the land around the Arctic sea, due to loss of snow coverage, our number is probably a good lower limit to the true extent of the additional warming.
So for the sake of argument, let’s assume this estimate of ours is correct. The combined “radiative forcing”, which is the scientific term for the overall heating from solar radiation, will thus be about 2.3 + 0.9 = 3.2 watts per square meter.
What’s the significance of this number?
Dr. James Hansen, an authority in climate science, stood before the U.S. Senate in 1988 and declared we were already seeing the effects of global warming due to human-caused greenhouse gas emissions. He proclaimed at the time that we would see a great deal more warming in the decades ahead (about which he has turned out to be correct).
In a paper in 2008 detailing the effects of C02 on climate throughout the Earth’s history Hansen and others pointed out that it was a radiative forcing of just 3.5 watts per square meter that forced the Earth to transition out of the last ice age into the stable “0 degree world” we enjoyed for the 10 thousand year period leading up to the industrial age [Ref. HANSEN2008].
Three and a half watts of heating raised the Earth’s temperature by 4 degrees Celsius. Hansen also pointed out that it would take an excess of just 4 watts per square meter to reach a new equilibrium in which all the ice of the world is completely melted.
So when the Arctic summer ice shrinks down to 2 million or so square kilometers we will “jump” half of the way from where we are now to the state that eventually implies an ice-free world. In fact, by the time we get to this “midway point” (around the year 2040) the amount of C02 in the atmosphere is likely to have surpassed 460 ppm and the CO2 forcing will have increased by about another 0.6 watts per square meter (half that amount per decade [Ref. AR5CHAP8]). We will be close (at 3.8 watts per square meter in 2040) to the equilibrium forcing of 4 watts per square meter that Hansen believes is required to fully melt Greenland and Antarctica (again, note that we haven’t included the forcing due to the loss of albedo on land around the Arctic sea, or the expected increases in forcing due to methane or any other greenhouse gases during this period).
In all likelihood, somewhere around 2040 to 2050, we will find ourselves committed to an iceless 5 degree Celsius world where sea level will eventually rise over 200 feet. This is not science fiction. This is not “maybe”. This is basic physics matched up with observation of the historical sea level, sea ice extent, temperature, and greenhouse gas records.
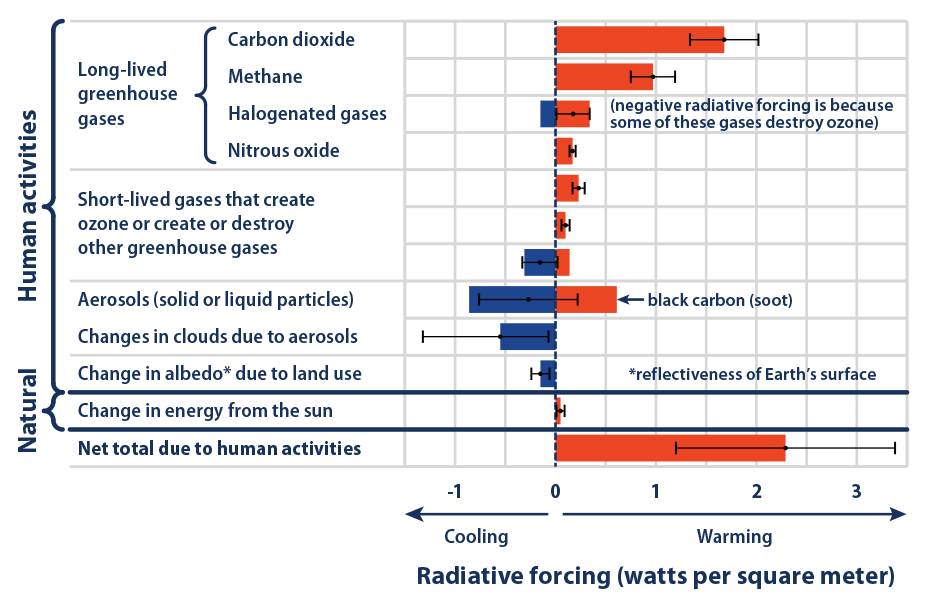
Contributions to the total radiative forcings due human-based emissions, as calculated by the Environmental Protection Agency in 2016 [image credit: Ref. RADFORCE]
What does it mean that the total radiative forcing, or warming of the planet, is currently 2.3 watts per square meter?
Well, in a world in energy equilibrium, as we expect was the case before humankind appeared on the scene and began upsetting the landscape and the air above it, the net radiative forcing would have been zero. Each day as much energy would have been radiated back into space as was absorbed from the Sun.
Let’s calculate how much energy we’re currently absorbing each day today due to the imbalance. For the calculation we will need to be aware of the following:
- one watt = one joule per second (a joule is the standard unit of energy)
- the surface of the Earth covers 510 million square kilometers, or 510 trillion square meters
- the number of seconds in a day is given by 24 hours times 60 minutes per hour times 60 seconds per minute, or 86,400
So 2.3 square watts per meter applied to every square meter of Earth’s surface for a 24 hour period gives us the total daily energy imbalance of the world.
It is 2.3 times 86,400 times 510 trillion joules, or roughly 100 million trillion joules. Not zero, as it once used to be.
For comparison purposes, the energy released by the atomic bomb that destroyed the city of Hiroshima in 1945 was estimated to be equivalent to 15 kilotons of TNT, or 63 trillion joules. Divide that number into our daily planetary energy imbalance and we find we are absorbing the energy equivalent of 1.6 million Hiroshima bombs.
Let that figure sink in for a moment.
For every day that passes now the potential destructive energy being absorbed by the Earth is equal to the energy of 1.6 million small atomic detonations. This is why climate scientists sometimes sound like alarmists – because they know you cannot expect to add this much energy daily to our planet and not expect some serious consequences as a result.
Because of the large heat capacity of the oceans and the fact that it is taking the bulk of this energy imbalance, we’ve so far been spared a great deal of the consequences. But this good fortune cannot last forever. Sooner or later, we as a species, will pay the energy debt. Or our children will.
The tragedy is that scientists have been able to figure out well ahead of time that there will be serious trouble ahead for humanity if it does not change its environmentally destructive ways.
But so far to no avail. The scientists have warned the world, and the world either is not listening, or is incapable of comprehending the scope of the environmental disaster that will proceed to unfold in slow motion.
One of the most obvious consequences: if no action is taken all the coastal cities of the world will be lost and coast lines moved inland as much as several hundred miles.
Already the contribution to global warming due to vast stretches of open (ice-free) Arctic ocean in the summertime months is estimated to be 25 percent of the current contribution due to greenhouse gases alone.
If this projected increase in the rate of global warming doesn’t scare you, it should.
This loss of Arctic albedo (sea ice) is happening right now. It has been happening for decades. And there is good reason to believe that we as a species won’t begin to take serious action on climate change until AFTER the ice has gone, the rate of warming has increased to more than one and a half times what it is today, and that oh-so-remote year 2100 future is coming at us faster than anyone expected it would.
Impending Loss of Fresh Water Supplies
Nor is it just the ice which is disappearing. Our fresh water supplies are going too.
One of the consequences of a warmer atmosphere is higher evaporation rates from the surface of the land. This increases the frequency and duration of droughts.
On top of this, the loss of Arctic ice increases the likelihood of extreme drought because of a complex interplay between the masses of Arctic-generated cold air, and the warm air which flows north from the equatorial regions.
Less ice in the Arctic reduces the difference in air temperature between the Arctic and the equatorial regions. The effect of this is to destabilize the “jet stream”, the river of Arctic cold air that ordinarily cools water vapor and drops snow at high altitudes on the land.
With a destabilized jet stream the warm air from the equatorial regions forces the cold Arctic air to make unusual excursions from its historical route across the top of the world. This causes the cold air to more frequently miss its historical targets and dump snow where it is currently not needed. For example, instead of putting snow onto the Sierra Nevada mountains in Northern California, that snow might end up on the Rocky mountains, or further east still.
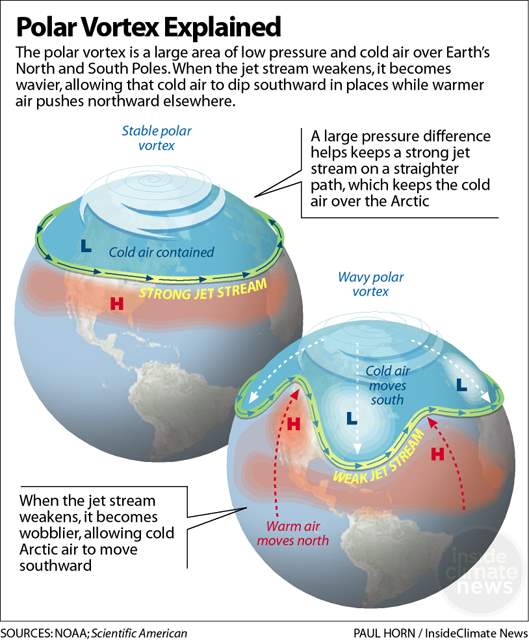
Arctic sea ice stabilizes the jet stream. When the ice is gone we can expect an even greater disruption to weather patterns across the Northern Hemisphere than we are seeing today [image credit: Ref. VORTEX]
The conclusion of climate scientists in 2004 was that “decreased Arctic sea ice causes drying of western North America”. Like Peter Wadhams, these researchers had begun asking questions about what effect the loss of sea ice from the Arctic might have on climate at remote locations in the year 2050 [Ref. DRY2004].
They saw that the shrinking albedo associated with more open ocean water in the Arctic would contribute significantly to the rate of warming in the region, and that ultimately this would affect the delivery of storm tracks that deposit snow in western parts of the United States.
This is particularly bad news for Californians but also for other human populations elsewhere on the planet which depend on snow pack as a year-round source of fresh water.
Whereas til now we have relied on melting snow pack throughout the spring and summer months to fill riverways and dammed reservoirs, today we are looking at an ever-decreasing availability of fresh water.
Even when the jet stream does put cold air over mountain ranges the increased temperature due to global warming can cause precipitation (rain) rather than snow to fall.
The result is water that runs off the landscape and is lost to the oceans rather than being stored in frozen form until it is needed for agriculture and urban use (by thirsty humans) in the months ahead.
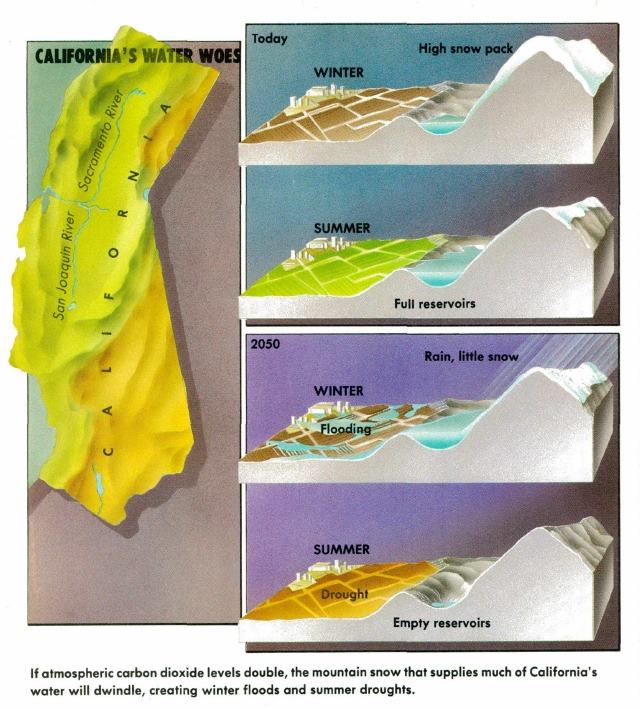
This 1988 prediction of global warming shows how the loss of snow pack in California could result in severe drought in the year 2050. Already (prior to 2020) we are seeing dramatic loss in California snow pack [image credit: Ref. GREENHOUSE]
This is a real problem where I live in the desert region of Southern California. Forty million people here depend on snow pack for water. Unfortunately most of them have no idea where their water comes from (other than out of the faucet) or that it is under threat of going away in the near future. Snow pack in the Sierra Nevada mountains is projected to reduce by more than 50 percent before 2060 (and as early as 2040), and reduce by almost 80 percent by the end of the century [Ref. SIERRASNOW].
This trend in fresh water scarcity is expected to continue around the world and lead to a dramatic restructuring of the landscape.
The western half of the United States, largely irrigated desert at the moment, will be transformed under a 5 degree world into something resembling the waterless Dust Bowl of the 1930s – the next arid Sahara with temperature extremes pushing close to 50 degrees Celsius [Ref. DROUGHT].
Even the size of the American desert will grow as the “100th Meridian”, the historical geographic divider between the humid east and arid west regions of the United States, the boundary between soils that can and cannot support crops without the aid of irrigation, “shifts” ever to the East.
Already since the year 1878 when the 100th Meridian was recognized as more than a line of longitude on a map of the U.S., the dry earth to the west of it has crept eastward about 140 miles into the 98th Meridian under the driving force of climate change.
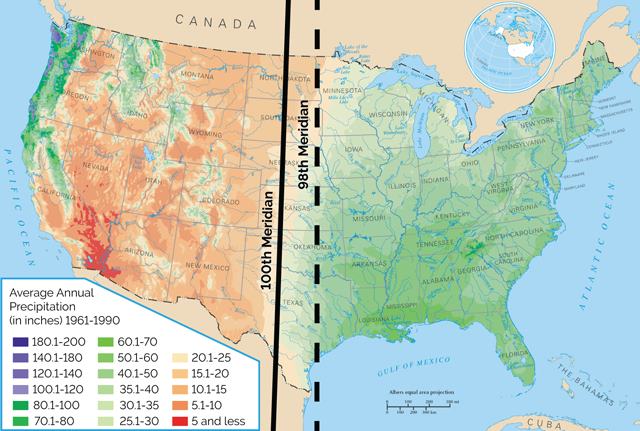
The 100th Meridian, once the dividing line between humid and arid climates in the United States has slowly ceded its celebrity to the 98th Meridian [image credit: Ref. 98MER]
Even if the boundary ultimately does not continue its eastward trek, certainly the difference in climate between the two regions is expected to sharpen, with increasingly dry conditions to the west and more frequent precipitation to the east. And everywhere it will continue to get hotter, especially in the summer months.
If you happen to live in one of these wetter areas, like the East Coast of the United States, you might think you’ve managed to escape the consequences of the fresh water scarcity problem. But in places where snow pack has always been scarce populations have tended to rely almost exclusively on drawing ground water for their source of fresh water, rather than build infrastructure to capture rain water.
The consequence of this is ground water supplies in the United States and across most of the globe are almost exhausted [Ref. GROUNDWATER]. Once they run dry they will remain dry, as the natural ground water refill time is of the order of thousands of years. According to Scientific American [Ref. OGALLALA1]: “Today the Ogallala Aquifer (one of the largest in the U.S.) is being depleted at an annual volume equivalent to 18 Colorado Rivers.”
It is not hard to see how this might not be sustainable [Ref. WATERWARS]. By some estimates the Ogallala – from which water is drawn to produce about a sixth of the world’s grain crops – could be dry by 2040, and in some places by 2030 [Refs. OGALLALA2,OGALLALA3].
Worse yet, we apparently have so little regard for the impending water crisis that we are literally turning vast quantities of the remaining water supply into biofuels. In 2017 approximately 140 million tonnes of maize was converted into ethanol [Ref. FOODCRISIS]. It takes 147 gallons of water to grow just one pound of maize. Crunch the numbers and you find this represents an annual loss of 45 trillion gallons of non-replenishable water we will surely one day regret having squandered.
The loss of fresh water due to climate change will not affect just our drinking water supplies.
Impending Loss of Food Security
The effect of diminishing fresh water resources on farmland utility and crop yields, not only in the United States but elsewhere, is especially worrisome. The world relies on maize (corn), wheat, and rice for approximately half of all its calorie requirements. You simply cannot grow food without a reliable source of fresh water. So when the world goes thirsty, by necessity it also goes hungry.
But even in regions that do manage to efficiently tap every last drop of their fresh water supply crops are still susceptible to extremes of temperature.
It doesn’t take an enormous increase in the average temperature of a season to destroy a crop yield [Ref. SHOCKS] [Ref. CORNSTRESS].
The reduction in annual harvest size for maize, wheat, and rice varies between about 3 and 17 percent per one degree Celsius of increased average temperature over the growing season.
In France in 2003, when the average temperature for the summer went up by 3.6 degrees Celsius, production of maize fell by 30 percent, wheat by 21 percent, and fruits (like grapes) by 25 percent. In Italy that same summer the maize yield fell by 36 percent [Ref. YIELD2003].
In 2018 drought parched the soils of Europe, resulting in overall grain losses in Germany by the end of summer of 26 percent. Some German farmers reported a 70 percent loss [Ref. GERMANDROUGHT].
This kind of historical record provides a glimpse into what we might expect as routine crop losses in a world perhaps 3 degrees Celsius above pre-industrial. It is one in which countries will regularly have to contend with shortfalls in food production. At the same time they may find their neighbors hard-pressed to come up with an excess of harvest to meet the food gap.
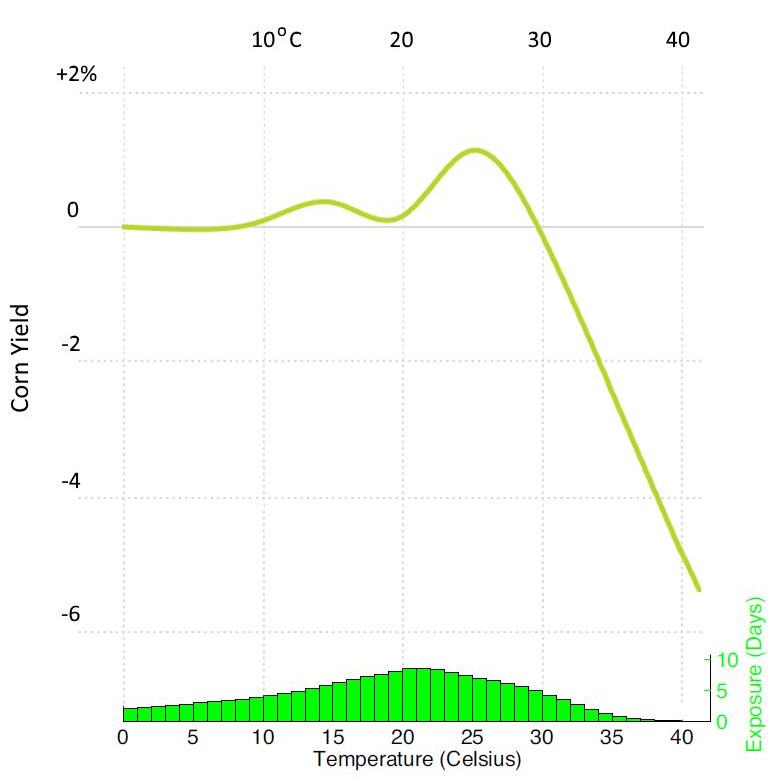
Average maize yield relative to 0° Celsius day, for the period 1950 to 2015. The optimum temperature for growth lies between 25 and 30 degrees Celsius, after which the yield drops off dramatically. Bar chart shows number of days the crop experienced a given temperature, e.g. for 5 days of the season the temperature reached 30 degrees [image credit: Ref. 95CDAYS]
Nor are the largest of the world’s food producers likely to find themselves immune to crop losses. The United States will be particularly vulnerable, with summer temperatures regularly well beyond the 30 degree Celsius upper limit for sustainable wheat and maize yields. Extreme prolonged summer temperatures of 40+ degrees Celsius are likely to be routine by the middle of the century. Already U.S. farmers are wondering how they will be able to outsmart climate change in the coming decades, and they are less than optimistic about their chances [Ref. FARMERS].
At a time when the population of the world is expected to have grown by another 2 billion hungry mouths, the amount of available food is expected to fall by more than a quarter of what is currently produced. Combine heat stress with water stress and crops yields may be down by as much as one half of what they are today.
Given an estimated 700-800 million people today already lack sufficient access to food, the expected shortfall in food production in the decades ahead spells disaster for a significant fraction of the world’s population. No nation is likely to be spared, though some will fare far worse than others.
The notion of soaring food prices and even food rationing in America may sound strange, but it is increasingly likely to become reality in a world subjected to rapid climate change.
It is because of growing concerns that such possibilities no longer seem to represent the “science fiction” they once did, that in 2015 the world finally sat up and took notice of the crisis that now appears to be headed towards us with very little room for doubt.
The Paris Agreement: Humanity’s Last Hope, Or Climate Mirage?
If it seemed there was any real prospect that burning fossil fuels might lead to a dangerous destabilization of the climate we have grown to depend on for the 10,000 years leading back to the end of the last ice age you would think those in a position to limit human-caused greenhouse gas emissions would have done so.
After all, it’s a big deal when the fresh water supplies go away, the crops fail, fertile landscapes turn to desert, the oceans turn acidic, local temperatures rise enough to make some parts of the planet uninhabitable, and species begin dying off in droves (more than half are forecast to go extinct by the end of the century).
But taking decisive action has not turned out to be what those in power do when faced with a crisis that might not arise for several decades. Instead, history shows they punt the can down the road, rather than take any responsibility on the issue. Let the next generation deal with it – that seems to have been the mentality thus far, while the response has often been denial of the existence of any threat to the climate at all.
We have known since at least the 1980s that by the middle of the 21st century the global average temperature would rise by as much as 3-5 degrees Celsius over pre-industrial if we continued “business as usual” and made no effort to wean ourselves off greenhouse gas-producing fossil fuels. We should have begun to reduce our dependence out of a sense of caution. Instead, since 1980 we have dialed up our ongoing use of fossil fuels globally by more than 60 percent.
All along the way scientists have stepped forward to point out the potentially cataclysmic error of that approach. At every turn they have been met with skepticism from people with no training in science who nonetheless believe they are smarter than the scientists. Or at the very least morally superior, defending the rights of the populace to grow their country’s GDP with the assistance of cheap fossil fuels without interference from those whose “unproven theories” of global warming and calls to switch to clean sources of energy might hamper a century-long streak of wealth-building success.
It is hard to argue that the skeptics have not, so far, been very successful with their efforts.
Their strategy of muddying the waters with claims that climate science is “unsettled”, and needs further consideration, has largely been responsible for keeping the world from responding to the mushrooming threat of climate change.
But there comes a point when it becomes increasingly difficult to deny that “something” is happening today which looks an awful lot like what the climate “alarmists” predicted would happen if we waited long enough. This is no surprise to anyone who has studied physics. If you keep adding energy to a system, sooner or later it changes state. It doesn’t just sit there as though nothing was happening to it. It reconfigures itself.
The climate of planet Earth is now reconfiguring itself, possibly at the fastest rate in its history.
In 2015, in recognition of the fact that many countries are now incurring heavy economic, environmental, and socio-economic burdens due to changing climatic conditions and rising average global temperature, 195 countries got together in Paris to hash out an international agreement to stem the damage. Parties to the Paris Agreement agreed to finally take action to “decarbonize” their economies so that each nation can begin reducing its contribution to greenhouse gas emissions. The stated goal of the agreement [Ref. PARIS2015] is:
- To keep global temperatures “well below” 2.0 degrees Celsius (3.6 degrees Fahrenheit) above pre-industrial times and “endeavor to limit” them to 1.5°C
- To limit the amount of greenhouse gases emitted by human activity to the same levels that trees, soil and oceans can absorb naturally, beginning at some point between 2050 and 2100
- To review each country’s contribution to cutting emissions every five years for purposes of accountability
- For rich countries to help poorer nations by providing “climate finance” to adapt to climate change and switch to renewable energy
The international scientific body which guides the participating countries in this endeavor is known as The Intergovernmental Panel on Climate Change (IPCC). It was established by the United Nations Environment Programme (UNEP) and the World Meteorological Organization (WMO) in 1988.
Not everyone agrees that the climate science used by the IPCC is state of the art. The reports it publishes tend to err on the conservative side and its predictions for climate change often fall short of what we see happening in the real world (the rate of disappearance of Arctic sea ice being a good example). But the IPCC climate status and forecast reports are the most widely agreed upon scientific proclamations about the realities of climate change.
So what do they tell us about where we are headed in the years ahead?
Perhaps the most important and easiest-to-remember visual to come out of the IPCC reports is this graph of expected temperature rise according to several possible future scenarios that involve different rates of fossil fuel consumption by human society as a whole:
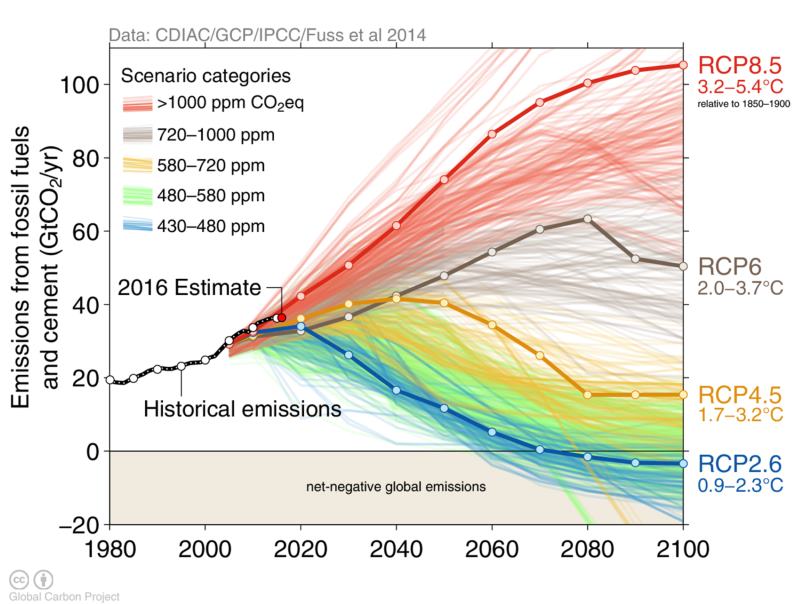
Possible futures based on climate simulations for temperature rise by the end of the century. Expected temperatures are shown on the right for a range of final radiative forcings in the year 2100 [image credit: GlobalCarbonProject.org]
To understand this graph we need to introduce the concept of a Representative Concentration Pathway or RCP. This is just the IPCC’s fancy terminology for describing different ways in which fossil fuels might be burned throughout the remaining century such that they result in a given final amount of greenhouse gases in the atmosphere.
To each RCP scenario is attached a number which represents the amount of radiative forcing introduced by that final amount of greenhouse gases.
For example, RCP8.5 corresponds to our current path, the “business as usual” scenario, wherein we take no measures to reduce our dependence on fossil fuels. At the end of the century the pursuit of RCP8.5 results in a radiative forcing (heating) of 8.5 watts per square meter and an atmospheric CO2 equivalent of about 1370 ppm.
The corresponding rise in temperature for an RCP8.5 pathway is about 3.2 to 5.4 degrees Celsius. The uncertainty in the final temperature reflects the fact that these forecasts are based on a large number of climate model simulations and it is only by looking at the aggregate forecasts that we gain some confidence in the likely evolution of the underlying system (i.e. the real world climate).
The IPCC settled on 4 representative pathways the world could dwell on as it tried to decide how to respond to the coming climate crisis.
The RCP8.5 pathway defines the upper limit of madness – the path we are on now. No rational person thinks we will continue to follow it all the way to the end of the century. There is also a reasonable argument to be made that the response of the climate to business as usual may even preclude this (as in an abrupt runaway climate response wipes out organized human society decades before we reach the year 2100 and brings fossil fuel burning to a swift end).
It is hard to imagine that as crops fail and coastal cities begin to submerge by the middle of the century we will keep on denying the evidence of our own eyes. On the other hand when scientists pointed out in the 1980s that continued use of fossil fuels could cause unmitigated climate disaster on this exact timeline they surely would not have expected the world to sail on with business as usual for the next three decades, accelerating our consumption of fossil fuels with every passing year.
Let’s take a brief look at these 4 pathways so that you can understand Paris Agreement goals and the terminology. With any luck you’ll be hearing a lot more about these in the years ahead:
RCP2.6 – A FULLY DECARBONIZED WORLD
RCP2.6 is the ideal scenario, one in which everything that could possibly go right does. All the nations of the world undertake a World War II-scale industrialization effort to combat the greatest challenge human civilization has so far faced. As fast as they possibly can, they fully switch from fossil fuels to clean energy programs.
But recognizing that this is not enough to restore the climate to its former stable state they invent technologies to suck CO2 directly out of the skies on an enormous scale and commit to this goal for as long as it takes (possibly centuries). The temperature continues to rise for a decade or two, but then it eventually comes down to about 1.5°C above pre-industrial by the year 2100 – a world warmer, but not too different from the one we live in now.
Unfortunately this scenario, based on what many scientists regard as wishful thinking and non-existent pie-in-the-sky technology, is not presently regarded as realistic or achievable. Not by anyone sufficiently familiar with the scale of the challenge.
The RCP2.6 / 1.5°C scenario represents where we might have got to if we had taken the global warming threat seriously (and decided to do something about it) when it was presented by scientists in the 1980s as the climate disaster in waiting it is turning out to be.
RCP4.5 – BIG LEAPS TOWARDS A GREEN ECONOMY
The RCP4.5 scenario is closer to what the signatories of the Paris Agreement are likely to pursue in the long run, when they finally get serious about their commitment to the preservation of a world that supports the continued existence of human life (though the final global temperature is not guaranteed to support it).
Note that, according to James Hansen, 4.5 watts per square meter implies the eventual melting of all ice on Earth and sea level rise in excess of 200 feet – the same response that would have been brought about in the higher RCP scenarios 6.0 and 8.5, but at a much slower rate.
If the signatories hold to this pathway significant progress will be made in switching from fossil fuels to clean energy programs. To dampen the effect of our failure to switch away entirely from greenhouse gas-producing sources of energy we will plant billions upon billions of trees in an attempt to pull some of the offending gas back out of the skies. The temperature will rise to (hopefully) no more than 2.0°C by the end of the century.
There will still be undeniable damage to the climate but we may get lucky and find it is manageable (at least in the short-term). This assumes that global temperature tops out in the lower half of the projected range of 1.7°C to 3.2°C and does not push the world into a state of runaway global warming (discussed later in this article).
On the one hand there is likely to be widescale acknowledgement that we have skated up to the line but averted short-term disaster. On the other there will be the naysayers who decry all of the investment in infrastructure and call for further rounds of investment to be abandoned going forward – because there was never really a problem in the first place, their proof being that humanity still exists.
Currently it has been 3 years since the drafting of the Paris Agreement and there has been no discernible swing away from the business as usual path despite the pledges of the signatories. Still, many of these people have children and grandchildren who will inherit the mess their elders are poised to leave behind if their efforts to implement the Paris Agreement fail. So there is still hope for progress in the years ahead.
RCP6.0 – SLOW BUT DEFINITE POLICY DEVELOPMENT
RCP6.0 is the pathway the most pessimistic climate scientists believe will be followed. It is characterized by a lack of will to make difficult political decisions at home. Considerations for short election cycles outweigh moral duty to future generations. Yet SOME progress is made at the city and state level, where local governing bodies act independently of short-sighted national policy makers beholden to corporate interests, especially those financed by the fossil fuel industry.
We continue to burn fossil fuels to the point where, by the end of the century, greenhouse gas concentration in the atmosphere has more than doubled from the 410 ppm of today to 850 ppm. Temperatures continue to rise and go beyond 3.0°C.
At this point the climate during the summer is unbearable across much of the globe. Parts of the planet, including the American Southwest and the eastern provinces of China, are not survivable outdoors for more than a few hours. Crop failure is routine. For large portions of the planet local populations are subject to sporadic famine and severe water shortages.
Now that it is impossible to deny the severity of the problem and our failure to adequately address it governments will see bloody rebellions. When citizens understand that with each passing year not only their children’s prospects for survival are diminishing, but their own prospects as well, they will want to take their anger out on someone.
More importantly, it is unlikely that global temperature can be stabilized above about 2.0°C and the runaway global warming scenario will be an ever-present threat that looms large in the minds of every informed citizen on the planet. When there is no future to build towards societies become unstable, chaos widespread.
At this point I tend to imagine that with each extreme climate event which claims the lives of tens of thousands of citizens the most vocal of the climate denialist political leaders (though it’s hard to believe any still exist by this point) will be dragged into the streets and executed to the roaring cheers of the crowd. Executives of fossil fuel power companies will be forced to build private fortresses to protect themselves.
RCP8.5 – BUSINESS AS USUAL – WE KEEP ON RELYING ON FOSSIL FUELS AS OUR PRIMARY SOURCE OF ENERGY
The “do nothing” RCP8.5 scenario is too bleak to speculate about. By the time we reach 2100 we more than triple the amount of greenhouse gases in the atmosphere today.
If the temperature continues to rise above 4°C it is hard to see how organized human societies can continue to hold together, let alone keep burning fossil fuels. But long before we get to this point it’s likely the warming will have triggered positive feedbacks in the Earth’s natural carbon cycle and caused runaway global warming (which is exactly as bad as it sounds). All sentient life on Earth perishes within a time span of a few short years.
Note on RCP scenarios:
When considering these RCP scenarios it is worth keeping in mind that they assume a controlled management of fossil fuel burning activity (and greenhouse gas release) throughout the century.
The IPCC hews toward a more conservative view of global warming futures. These are scenarios in which unfactored positive feedbacks in the environment that might cause an escalation in the release of natural greenhouse gases (from, for example, rapidly thawing permafrost) DO NOT take place and unexpectedly push, say, an RCP4.5 pathway into something that more resembles an RCP12.0 pathway, or worse.
Unfortunately there is no guarantee that any pathway other than the unlikely RCP2.6 pathway won’t lead to unexpected and unwelcomed surprises.
This is one of the reasons RCP2.6 is held out as the primary objective of the Paris Agreement. But runaway warming is rarely ever acknowledged publicly as a possible outcome of failing to act sufficiently swiftly to curb greenhouse gas emissions.
Nonetheless, it is a possibility that has been taken seriously by climate scientists for some time now and which deserves not to be ignored.
Sanity Check – Could Those Worrisome Temperature Projections Be Wrong?
Before we discuss the implications of runaway global warming let’s pause for a moment and consider the possibility that maybe the scientists have got it wrong…
Skepticism is the logical response to a prediction of what amounts to the end of the world for us.
If ecosystems, agricultural production (food), and fresh water supplies are projected to crash at around 3 degrees of warming and bring human civilization down with it then a reaction of alarm is natural. But so too is a healthly dose of skepticism.
Could the scientists have got it all wrong? Could there be a fundamental mistake somewhere in their interpretation of everything known about the way the planet will warm in response to the greenhouse effect?
My belief is that it is hard to see how this could be.
The basic prediction is that if nothing changes in the way we extract energy from fossil fuels global temperatures are going to rise between 4 and 6 degrees Celcius before the end of the century.
So, I think it is natural to ask whether there is any way we can verify this prediction without having to spend years studying for a degree in climate science.
And there is.
We can do another of those “back of the envelope” calculations which ought to be able to tell us whether the claims of the scientists are credible.
I am going to show you how to perform a very crude calculation of global temperature rise using nothing more than basic physics. I contend that a diligent high school student could perform this calculation in science class and get the same result.
The calculation of the expected temperature increase is going to rely on three pieces of information:
- The amount of energy it takes to raise a kilogram of water by 1 degree Celcius
- The amount of water available in the oceans for warming
- And the rate of energy transfer into that water caused by the greenhouse effect
Before I get to the simple calculation, let me explain the assumptions behind the simple model I am about to use.
We have already discussed the size of the radiative forcing (warming influence) we are experiencing today due to the greenhouse effect. According to the Environmental Protection Agency it is around 2.3 watts per square meter, for each square meter of the planet. So we know the total amount of energy currently being accrued by the planet per decade. It is roughly 370 billion trillion Joules.
Where does all that energy go?
The answer is most of it ends up in the ocean. Ninety three percent of it according to the climate scientists. Remember, 70 percent of the planet is covered in water, and energy absorbed on land is typically reradiated back into the atmosphere as infrared energy which then has a good chance of finding its way into the ocean. So let’s simplify and assume all that decadal (per decade) energy goes into the ocean to warm it.
By how much does the ocean warm?
What we are after here is to learn the final surface temperature of the ocean. This is relevant because the ocean surface will be in constant contact with the atmosphere. So to a good approximation, it will share the same temperature. If the ocean surface increases by one degree then so too should we expect the atmosphere to warm by about the same amount.
Now comes the bit where we need to put on our oceanographer hat and ask what fraction of the ocean is warmed by the decadal energy being poured into it? Is it all of it?
As it turns out, no.
The ocean does not warm the way a pot of water on the stove does when you place it above a source of heat. In the case of the ocean the energy is applied from the top.
According to the National Oceanic and Atmospheric Administration (NOAA) it is only the water in the upper 200 meters of the ocean that mixes with the surface and maintains a uniform temperature (of roughly 13 degrees Celcius today). From a depth of 200 meters on down the temperature plunges quickly until it reaches about 4 degrees Celcius at 1000 meters depth (as shown in the following NOAA graph).
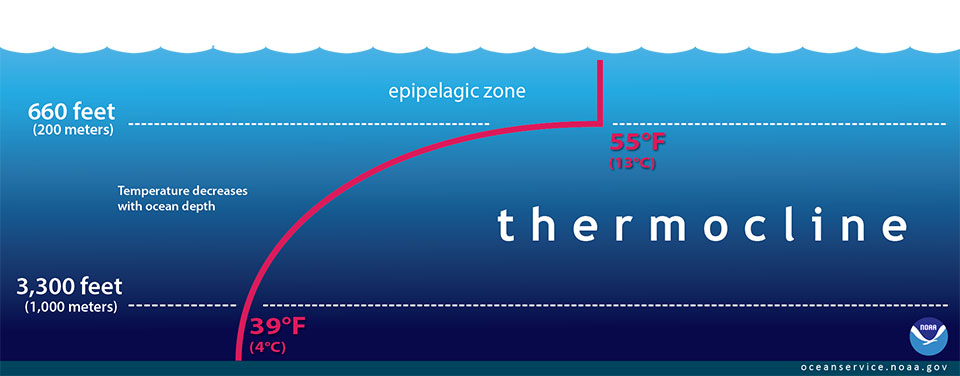
Most of the energy absorbed into the ocean initially accumulates in a thin layer extending 200 meters from the surface [image credit: Ref. EPIPELAGIC]
This topmost layer of ocean water is known as the epipelagic zone.
Energy transferred into the epipelagic will eventually fold into the lower water layers of the ocean, but the time span involved is of the order of centuries. If we wish to know how the surface water will warm in the following decades then we should concentrate on the epipelagic zone which contains approximately 71 thousand trillion cubic meters of water, or a thousand times as many kilograms of water.
The energy required to heat this amount of seawater by one degree Celcius (which is about 4,000 Joules per kilogram) is approximately 290 billion trillion Joules.
If we divide the decadal energy added to the ocean by this amount of energy required to heat the epipelagic by one degree we arrive at the decadal (per decade) temperature increase.
It comes out to 1.3 degrees Celcius.
So this very crude calculation of the amount of global warming we can expect to see in the years ahead is not miniscule. Our rough calculation which ignores any ocean mixing, and ignores any melting of the ice sheets over Greenland and the Antarctic (both of which would slightly lower the overall temperature rise) predicts more than a 10 degree Celcius temperature increase by the end of the century.
The IPCC is predicting about half that temperature rise and now the numbers really don’t look crazy at all.
Runaway Global Warming – If Not Avoidable, Then How Soon?
If you look back at the sea sediment and ice core graphs showing climate variability for the last 400 thousand years you cannot help but notice the striking regularity of the sawtooth rise and fall of both temperature and atmospheric C02 concentrations.
Up until the end of the last ice age the Earth had settled into a highly regular climatic pattern. It is one in which a cycling of C02 between the atmosphere and the oceans caused a corresponding cycling of lower and higher temperatures which added and removed ice sheets to the land masses. That ice in turn lowered and raised sea level across the globe.
There is every reason to think this cycle would have continued on, essentially indefinitely. In other words the Earth’s climate had settled into a stable cycle where the difference in average global temperature (compared to today) varies between 0 degrees Celsius and approximately minus 5 degrees Celsius.
On the other hand, you might recall how James Hansen suggested a radiative forcing of just 4 watts per square meter could eventually take us from where we are now to a (plus) 5 degree Celsius world.
So how do we get from a stable (1.2 million year old) “temperature loop” that seems to want to persist, to a new temperature state in the near future that will reside well outside it?
The obvious answer is that we are pulling carbon out of the depths of the Earth – where it has been locked away for millions of years in the form of coal, oil, and gas, and where it would have continued to remain cut off from the climate system for millions, if not billions, of years more – and we have liberated it into the atmosphere in the form of C02 emissions.
We took a system with a regular thermodynamic cycle maintained with a fixed amount of (recycled) C02 and we destroyed the cycle by connecting it to a new source of C02 – a post-industrial civilization built on the burning of fossil fuels.
The coming together of the world in 2015 to sign the Paris Agreement was a recognition of the idea that, in order to avert climatic catastrophe, we have to change the status quo – to break our addiction to fossil fuels and instead use sources of renewable energy to run the “engine” of human civilization.
The reward for doing this, the theory goes, is that we can limit the rise in average global temperature to no more than 2 degrees Celsius.
But can we?
In 2018 Johan Rockström from the Stockholm Resilience Centre and more than a dozen other international climate scientists released a study [Ref. HOTHOUSE] suggesting there may be no such thing as an Earth climate stabilized at 2 degrees Celsius.
Instead, they suggest we may be beginning down a path that automatically pushes us well past the 2 degree world we are anticipating.
They think our current pursuit of 2 degrees might slingshot us into a “Hothouse Earth” state where the average global temperature is significantly higher than 2 degrees, and from which Earth’s climate may not be able to escape for thousands of years…
Needless to say, humans are no longer part of this story, having been a strict casualty of a rapidly heating world in search of a new thermal equilibrium.
In essence Rockström’s group is repeating the “ice-free world” story I related to you on the basis of James Hansen’s work from about a decade earlier.
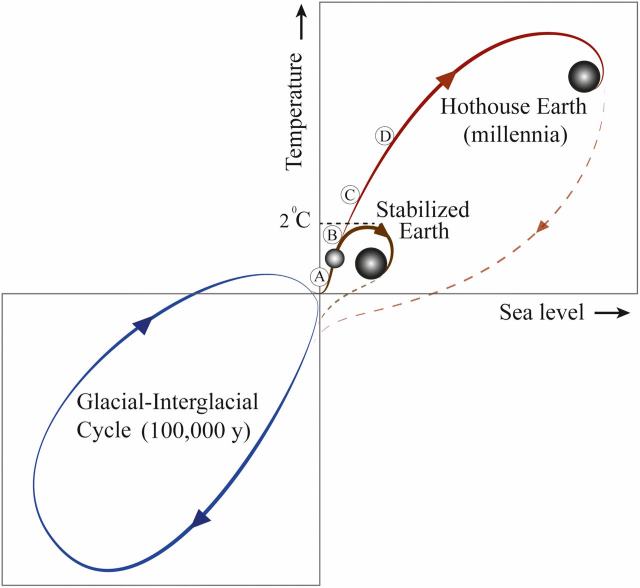
Rather than remain on the habitable “ice ages” climate loop (blue) we have recently switched to a potentially dangerous climate path (red, point A) that could put us into the “Hothouse” state (the C path) if we do not immediately stabilize our climate trajectory (by taking the B path) [image credit: Ref. HOTHOUSE]
The authors of the study point out that upsetting the balance of carbon dioxide available to trap the Sun’s energy has knock-on consequences for many other natural processes. Once started, these processes contribute their own source of CO2 and could cause an escalation in the process of global warming.
As an example, I have already pointed out how the loss of Arctic sea ice will significantly increase the total radiative forcing, causing a sharp rise in the rate at which temperatures increase across the globe.
This rise in temperature may then thaw the permafrost areas of the northern latitudes of Alaska, Canada and Siberia. These frozen grounds contain huge amounts of undecayed organic matter. Once thawed, these will be acted upon by bacteria to produce gigatons of methane and carbon dioxide. Possibly hundreds of gigatons.
Additionally, off the coast of Siberia in the waters of the Arctic is an area of shallow sea bed that covers an area of roughly 2 million square kilometers. Below that sea bed is believed to be more than 1500 gigatons of frozen methane that could be released if the waters above the sea floor are warmed sufficiently.
Until now these waters have remained close to zero degrees Celsius, the freezing point of water. But once ice in the Arctic disappears for good these waters will warm under the influence of the summer sun.
Compared to the deepest parts of the Arctic sea, which descends to 5 thousand meters, the shallow regions range from about 50 to 100 meters in depth and will warm rapidly.
The only question is whether a warm Arctic sea will cause significant release of methane gas during the remainder of this century. If it does the consequences for humanity could be catastrophic. This is because, pound for pound, methane has more than 100 times the warming power that C02 does when the gas is first released. It is a potent greenhouse gas which takes about 8 years to break down into carbon dioxide and water [Ref. METHANE].
With all the extra carbon dioxide and methane released by these “thawing” events the average global temperature will rise even further, causing the forested regions of the world to dry out. This makes them increasingly susceptible to massive outbreaks of wildfires which consume the trees and render a good portion of them into more CO2 emissions.
Each time one of these carbon dioxide amplifying “tipping points” is crossed it causes additional global warming and increases the likelihood of the next tipping point also being crossed.
Another example: with higher atmospheric temperatures the upper surfaces of both the Greenland and Antarctic ice sheets will melt more rapidly. In the case of Antarctica, warmer seas will also eat away at the ice shelves of West Antarctica.
If the ice sheet over Greenland disappears it will have two significant effects. First, the loss of reflective ice will decrease the albedo of the planet and more of the Sun’s light will be absorbed to warm the Earth.
Secondly, all the ice water pouring into the North Atlantic will likely shut down the northward transport of heat from the southern oceans. This will cause the waters around Antarctica to warm up even more quickly. This in turn will release more CO2 from the oceans and also directly cause the West Antarctic ice shelves to collapse even faster, further reducing Antarctic albedo…
The authors of the 2018 study addressed ten such tipping points which could be triggered, one after the other, over a period of decades or longer, once we reach a critical point in the global warming process.
When we shall arrive at that point we do not yet know. But the authors suggest it could coincide with the 2 degrees Celsius limit of warming written into the Paris Agreement as the upper limit of average global temperature we should try hard not to cross.
The danger is that once the critical point is reached where natural carbon-cycle processes begin tipping, they may continue to do so as part of an unstoppable chain reaction. There may be no way to stop them from continuing to tip, even if we reduce our greenhouse gas emissions all the way to zero.
This is what we mean when we use the term “runaway global warming”. It represents a complete loss of control of the climate system, and results in regional temperatures eventually entirely incompatible with life as we know it – and very probably incompatible with the concept of human life, let alone organized human societies.
In his book Storms of My Grandchildren Dr. James Hansen refers to the concept of runaway global warming as the Venus syndrome, a reference to the fact that long ago carbon dioxide became the dominant gas in the Venusian atmosphere (of which it makes up 97 percent). On the surface of Venus today the temperature is around 450 degrees Celsius, hot enough to melt lead.
Hansen says of the prospect of a runaway climate on Earth: “I’ve come to conclude that if we burn all reserves of oil, gas, and coal, there is a substantial chance we will initiate the runaway greenhouse. If we also burn the tar sands and tar shale, I believe the Venus syndrome is a dead certainty.”
Here’s the thing about exponential change, which applies to the rate at which runaway processes take hold. For the longest time they look meek and innocuous. Sea level is rising now at about 3 centimeters per decade. Big deal, right? But eventually it will ramp up to 10 centimeters per decade, then half a meter…
All of a sudden this weak effect is drowning our cities, washing away communities when seas ride in on storms of unprecedented size, and everybody is demanding to know why nobody saw any of this coming or did anything about it while there was still time to do so.
The Intergovernmental Panel On Climate Change Moves Up The Timeline For Concern
If you’ve read this far you know the magnitude of the climate change threat is immense. On the other hand, if the implications are so worrisome surely world leaders would have done something about it by now instead of just ignoring the problem for decades and hoping the fuss would all turn out to be due to one very big mistake on the part of scientists.
Well, unfortunately the situation has not turned out to be the equivalent of a 60 year clerical error on the part of climate scientists (thousands of whom have been seriously modeling climate for that entire period and casting fairly accurate predictions about what lies ahead).
Every year that goes by we learn more about the likely fate in store for us, and the predictions become both more specific and more dire. In other words we don’t just continually reaffirm that the science is solid, we are repeatedly reminded that our predictions consistently underestimate the severity of the problem.
As an example of this, in October of 2018, as part of their 48th Session held in Incheon, Republic of Korea, the United Nations Intergovernmental Panel On Climate Change released a report summarizing possible emissions path scenarios for limiting climate change to no more than 1.5°C [Ref. IPCC2018].
The report, which took more than two years to prepare, was commissioned by representatives of low-lying island and nation states concerned that they would be submerged by rising seas long before the average global temperature reached 2 degrees Celsius. They asked for an assessment of the differences to be expected between a 1.5°C world and a 2.0°C world so that future climate governance could take the information into account.
The thrust of the report is that IPCC now realizes they should have used 1.5°C everywhere they used the 2.0°C figure in the Paris Agreement.
Basically the report says: Oops, the impacts on human civilization for a given rise in temperature are going to be worse than we previously believed and there’s a lot less time left to tackle the problem (perhaps as little as 12 years) before we are looking at being well on our way to locking in dangerous and irreversible changes to the climate. We thought 2.0°C was the guardrail against catastrophic change and now we see it is closer to 1.5°C, moving the crisis time frame from perhaps 2050 to 2030…
Ninety-one scientists from 40 countries prepared the report after analyzing 6,000 scientific studies.
Among the points made by the report, titled “GLOBAL WARMING OF 1.5°C”:
- The 2.0°C world will be significantly less hospitable than the 1.5°C world, so we should act now to avoid being saddled with the consequences of the warmer scenario.
- No matter what we do, the 1.5°C world is likely to be reached as early as 2030 (and almost certainly by 2050). But if we fail to make sufficient changes (of “unprecedented scale”) to the world’s fossil fuel-based energy system by 2030 we can expect the global temperature to keep on rising well beyond 2040, the year by which we should anticipate catastrophic changes to the climate. For example…
- At 1.5°C the Arctic is likely to be ice-free in the summer once per century. At 2.0°C the frequency changes to once per DECADE.
- At 1.5°C the world’s coral reefs (on which 25 percent of marine life depend) will be bleached to 70-90 percent. At 2.0°C is it virtually all gone ( more than 99 percent).
- At 1.5°C rising seas will displace 10 million fewer people from their homes. At 2.0°C small pacific islands and large parts of other countries (like Bangladesh) will be submerged beneath sea water.
- Loss of access to fresh water supplies across the globe will be twice as great at 2.0°C compared to 1.5°C
- Collapse of West Antarctica ice shelves and/or melting of the Greenland ice sheet could eventually result in multi-meter rise in sea level. These instabilities could begin to be triggered around 1.5°C to 2°C of global warming.
- To limit warming to 1.5°C greenhouse gas emissions must be reduced by 45 percent from 2010 levels by 2030, and eliminated entirely (by 100 percent) by 2050.
- The remaining carbon budget for limiting warming to 1.5°C with 66 percent probability of success is 420 gigatons – or 10 years of burning fossil fuels at the current rate of 42 ± 3 gigatons per year (thereby exhausting the 1.5°C carbon budget by 2030).
- All pathways that limit global warming to 1.5°C with limited or no temperature overshoot assume carbon dioxide removal (from the skies, using currently non-existent technology) on the order of 100–1000 gigatons of CO2 over the 21st century.
- Species under threat. The number of plant and vertebrate species losing half their habit will be TWICE as great in the 2.0°C world as in the 1.5°C world. For insects, THREE times the number of species will be similarly affected.
- The estimated cost to the world economy of damage wrought by climate change will be $54 trillion by the time we reach 1.5°C, $69 trillion by 2°C, and $551 trillion by 3.7°C (and no that’s not a typo, the collapse of civilization comes with a huge price tag).
While the media has given the report a lot of short-term attention for it’s “dire” tone, many experts familiar with the state of the climate and the IPCC’s reluctance to go too far out on a limb with their predictions think the report is understated.
Dr. Peter Wadhams, the Arctic sea ice expert thinks the predictions about the frequency of ice-free Arctic summers are laughable. He shakes his head at the notion of an ice-free sea once per century in a 1.5°C world. The first such event is likely just years away, he points out. And it is expected to be a recurring event.
The problem, of course, is that IPCC does not issue proclamations on the more debatable points of climate science, like those which involve forecasting events that depend on “tipping point” scenarios such as the collapse of the Arctic sea ice. Or the release of methane from the Arctic sea floor once the ice is gone. You will find very little talk of runaway global warming in IPCC documents. This seems likely to change until we see the events playing out before our eyes.
An interesting statement about the stark reality of the inertia of greenhouse gas warming can be found near the beginning of the summary version of the report [Ref. IPCCSR15,A2.1]: “Anthropogenic emissions (including greenhouse gases, aerosols and their precursors) up to the present are unlikely to cause further warming of more than 0.5°C over the next two to three decades (high confidence) or on a century time scale (medium confidence).”
The IPCC is saying that if the world shuts off overnight all fossil-fuel based sources of C02 emissions – all electricity-generating coal- and gas-fired power generation plants, all cars, trucks, planes, ships, all domestic and industrial heating systems – if the world stops in its tracks and does not start back up again, then it is likely the average global temperature will not rise by more than another half a degree Celsius over the next 30 years. Not won’t rise by more than that amount, but probably won’t.
And they are less sure about it not happening if the time scale is stretched out to a full century. In other words, unless we suck CO2 out of the skies there is a good chance we will get to experience the 1.5°C world described in the report no matter what we do. Because of course the world is exceedingly unlikely to reach the IPCC’s suggested goal of zero global emissions by the year 2050, let alone power down overnight to do it.
Much of the focus of the media has been on the cost of diminishing the world’s dependence on fossil fuels by investing in clean energy, improving energy efficiencies, and adjusting practices that would allow us to draw down more of the carbon dioxide emissions already present in the atmosphere. The IPCC has said that if nations invested 2.5 percent of their GDP, or about $2.4 trillion globally each year, in the restructuring they may be able to perform the required transition in 20 years.
It is a lot of money. On the other hand, if we do not invest adequately now in climate-friendly infrastructure a similar amount will likely be paid out in the years ahead on disaster relief and rebuilding efforts and we will be no closer to solving our climate problem. We will merely be a whole lot poorer, just as vulnerable, and still looking down the barrel of ever-worsening climate.
It is also worth noting the estimate of 100-1000 gigatons of C02 that might need to be sucked out of the skies to keep warming within acceptable limits. Assuming a cost of $100/ton for recovered CO2 (roughly the cheapest we can do it today at any kind of scale) this would amount to a minimum cost of $100/ton x 100 billion tons = $10 trillion. The larger cost estimate (pulling back 1000 gigatons) would be 10 times this number.
This dollar figure is a good indicator of how much damage we have allowed the fossil fuel companies to inflict on the environment while we all turned a blind eye to what was going on. Admittedly that covers about two centuries worth of cumulative damage. But about half of it took place in just the last three decades or so – after the point at which we were fully aware of what we were doing.
The logic used by the polluters, of course, was that the cost of the clean up should be left to future generations to deal with. Well, the future is here and we and our children are the generations which will be forced to pay whether we like it or not. Either in dollars, or as increasingly seems to be the case, dramatically shorter life expectancy.
So, given the bad news, is there any good news to offset it? For instance, are signatories to the Paris agreement keeping up their pledges? How well are they combating carbon emissions at home?
According to the 2018 IPCC report: “Estimates of the global emissions outcome of current nationally stated mitigation ambitions as submitted under the Paris Agreement would lead to global greenhouse gas emissions in 2030 of 52–58 gigatons CO2 equivalent per year.”
That’s roughly 30-45 percent HIGHER emissions than in 2010. That’s not 45 percent LOWER than the 2010 emissions, which is the required reduction suggested by the IPCC to limit global warming to 1.5°C.
So you can see the problem and how much of a challenge we have ahead for ourselves. Right now we are going in totally the wrong direction.
The Role Of The Individual – What CAN You Do? What SHOULD You Do?
Feeling powerless to do anything about the impending threat of climate change is a natural response to discovering the true scope of the problem we face.
It is easy to lose hope that anything can be done, let alone that YOU, an individual, might be able do something about it. But if we all take that attitude the future of humanity is easy to predict. It ends. Very likely before the turn of the 22nd century, and possibly a lot sooner than that.
This is not an attitude of fatalism. It is a cold hard assessment of what the science suggests.
At this stage it is apparent that no matter what we do we are in for a very rough time. We are literally at that point in history where humanity has to decide whether it is willing to make sacrifices to ensure we are still here two generations from now.
I am willing to make those sacrifices. I am willing to be lead by people who make the hard decisions for us. I will support them. I hope you will too, for future generations, but also for your children and for mine, because they WILL be affected in ways so dramatic that you will be stopped in your tracks if you carefully think them through.
In fact, if experience is any guide, you will wake in the dead of night and in the split second it takes you to realize you are once again in the here and now your mind will go from the thinnest state of awareness to focused terror as you remember what is coming and the blood begins to pound in your ears. It is more a sensation than a realization that forces you awake, as though you were startled by another bolting upright from a nightmare in the bed beside you, an involuntary reaction to a sudden and emergent threat of death, an internal scream that echoes your exploding heart rate: “Climate!”
Yes, this is a real thing, this horrifying realization of what is possible when you soberly weigh the evidence. It can change your brain chemistry and leave you shell-shocked. I’ve been through it. But eventually you learn to live with the discomfort of the prospective death of humanity, just as you once learned to live with the disturbing realization that your own life must come to an end. Much harder to square away is the notion that your children may also die as a result of what we have put in motion. I have not been able to do it, and I suspect you will not be able to do it either.
So what CAN you do about any of this, so as not to feel completely powerless?
I suggest considering the following possibilities, new ways perhaps of aligning yourself for changes we will all ultimately need to make if we are going to beat this threat. Nothing less than a sea change in the way we think is going to be required to do this. So, here’s me tapping you on the shoulder and saying “I know you’re up for this.” Because you have to be. Even if you close this page now and try to forget about the issue of climate you will eventually be forced to return to it. Unfortunately, sooner or later, you will not have any choice in the matter.
Hopefully you can already see how you will be doing yourself and everyone you know a favor by beginning to make these changes today, when you can make the greatest impact.
The bottom line is we need to decarbonize society in every way we can, and as fast as we can. This is not about deconstructing the economies of the world, powering down civilization, or any nonsense like that, no matter what the naysayers might try to argue as a reason for your non-compliance. It is about reorganizing the way we go about extracting energy from the physical world so that we can continue to live in harmony with it.
This is not an economics problem, it is a problem of the sustainability of living systems constrained by the laws of physics. As the famous physicist Richard Feynman once said, “Nature cannot be fooled.” Only we risk fooling ourselves if we fail to heed it warnings, which are increasingly coming at us in the form of more frequent and more powerful storms, floods, droughts, heat waves and species extermination events. We all need to wake up, and to do it fast.
Here’s a short list of things you can do, as an individual:
- Share this page with others (use the social buttons above)
Nobody else is going to do their part, which is to support the effort to decarbonize, if they do not understand the scope of the problem. So help them with that by referencing this page and asking them what they think about it.
The basic assertion is that climate change presents an existential threat to humanity (that is, one in which doomsday is a potential outcome). The fundamental question to be answered is this: Can we survive that threat? You can be certain no one knows the answer and will not know for at least several decades. But this is a discussion we have to have with ourselves right NOW, while we might still have a say in what the answer will be.
I have tried hard in this article to provide you with a “bird’s eye” view of the problem of climate change. The presentation is not meant to be complete, or to be precise, but to be reasonably close to the picture painted by the scientific community. You will find references at the end of the article to help you if you want to go deeper.
- Support a revenue-neutral carbon tax (see next point)
A carbon tax is a political and economic tool that could just work to get us off fossil fuels and onto renewable energies. The basic idea is that the government institutes a tax on purveyors of coal, oil, and gas. For every one ton of carbon dioxide that would be produced from burning any of these as fuels, a fee of, say, $100 would be collected by the government the first year the tax is implemented.
This practice would discourage the fuel providers from dealing in fossil fuels. To disincentivize them more, the tax would increase year after year until the point was reached when it was no longer profitable to provide these fuels to society. In the interim the companies would be forced to move their operations further and further into non-taxed renewable energies, like wind and solar.
Naturally the fossil fuel providers would pass the cost of doing business with coal, oil, and gas onto their customers. This is not a weakness of the carbon tax, it is an expected development. Products that produce CO2 emissions would rise in price every year, forcing people to look for other (clean) ways to meet their power/fuel needs. This is desirable. Let me say it again, the “pain at the pump” as gas prices increase is DESIRABLE. It forces us to make the hard choices, which really ought not be that hard given the alternative (being snuffed out by runaway global warming).
But to offset the discomfort of pricing carbon taxes the government could also implement a version of the tax known as “fee and dividend”. They collect the fee (tax) from the fossil fuel companies and then disperse the collected revenue to the public so as to offset the rising cost of gasoline and every other product or service which has seen cost increases as a result of the carbon tax.
This fee and dividend approach is described as being “revenue neutral” – the government is collecting the tax for the citizens, not for itself. The net effect is that most of the cost of such a tax is borne by the richest, most carbon-intensive portion of society. Under the fee and dividend approach it is estimated that about 70 percent of the public will either break even cost-wise (price increases balance their carbon tax income), or they will make a (small) profit off the scheme. Those who would be worse off make up the smaller section of society that is creating the most emissions – frequent fliers, for example. Perhaps they can switch to using high-speed Japanese-style electric-powered bullet trains – those likely to be built out as clean energy alternatives to traveling by air become cost competitive.
- Vote for political candidates who pledge to decarbonize the economy
Look for people who agree that we need to switch to all renewable sources of energy: wind, solar, geothermal, hydro-electric, atomic…
If a political candidate is a climate science skeptic or denier vote for their opponent. If they refuse to make their position clear then try to figure out whether it is because they are a denier (the most likely scenario). The only political party in the United States with a clear and aggressive climate change policy right now is the progressive arm of the Democratic party. e.g. Bernie Sanders and Alexandria Ocasio-Cortez. Democrats are our best shot of seeing the U.S. Congress pass a carbon tax and aggressive decarbonization policies being put into effect.
If you are the suicidal type, or you do not particularly care whether or not your pre-teenage children will survive beyond their 40th birthday, vote Republican.
Elected Republicans have been doing their best since the 1980s to ensure the public remains confused about climate change science so they can keep collecting campaign contributions from the fossil fuel industry. After 30 years of denying the climate is changing they finally cannot deny the evidence any more (it is destroying the communities of their constituents).
If you are curious about what a political leader looks like who properly understands the measure of the stakes involved should we fail to step up, here is Elizabeth May, leader of the Canadian Green Party responding to the IPCC’s 2018 1.5°C special report. She delivered her “Churchill” address on October 15, 2018 while speaking before the House of Commons during an emergency debate about the urgent need to take real action on climate change:
And if you are curious about what future political leaders look like today, when they are too young yet to vote but nonetheless understand what they must do to effect change in the years ahead, here is 15 year old Greta Thunberg of Sweden, who has begun implementing a personal school strike (inspiring others across the world to do so as well) to get her message across in a way that is hard to ignore. Here she is telling the leaders of the world what she thinks of them at the COP24 climate change conference held in Poland at the end of 2018:
If a candidate as clear-headed on the issues as May or Thunberg should step forward, my advice would be to rally your community and vote them into office as fast as you can.
Prospective voters in the United States can find out how their Congressional representatives, and challengers for upcoming elections, score on several climate change issues at VoteClimatePAC.org.
Out of a maximum score of 100 each politician is assessed on their climate change position (what they think and what they say), their leadership on the issue (what they do), and their advocacy for a carbon fee. Not surprisingly, on the overall score Democrats tend very high (some as high as 100 points), Republicans very low (some as low as zero).
For stand out figures in the United States Congress, see Climate Heroes with a score of 100, and Climate Zeros with a score of zero.
How tough is it to find a Republican who will take a stand for action against climate change? To find out, watch this short documentary from the makers of the climate change series Years of Living Dangerously: “Safe Passage” with Bradley Whitford
- Electrify your life
Do yourself (and the world) a favor and make your next car purchase an electric vehicle. Gasoline-powered cars are going to quickly become like the beta cassette of the video wars. Obsoleted by the electrification of the automobile industry. No one will want to buy your car from you if it is attached to a CO2-polluting internal combustion engine.
About 28 percent of emissions in the U.S. come from road-based transportation (trucks and cars).
If you find yourself in the market for a new car why not check out the latest all-electric Tesla models (their popular model as I write this is the Model S3). But all big automakers will be switching over to electric models in the near future. Those that do not, like Kodak which failed to appreciate the rising popularity of digital photography, will go extinct.
Another 36 percent of emissions in the U.S. come from generating electricity.
Think about putting solar panels on your home to wean yourself off the electric grid so that you are no longer attached to coal- or gas-fired power-generation plants. Tesla sells wall-mounted batteries that allow you to store your daily solar energy and use it at night. So there is nothing to stop you from becoming energy independent.
- Avoid flying if at all possible
For every hour you spend in the air you are contributing something like 250 pounds of CO2 to the atmosphere. That means if you fly from one side of the United States to the other and back again, or you cross the Pacific, you are putting about two and a half tons of carbon dioxide into the atmosphere.
Remember, at least half of it will still be floating around doing damage one thousand years from now.
Another sobering fact: for every unit of carbon dioxide you put into the atmosphere, over the course of its lifetime it will trap 10,000 times as much energy in the form of heat as was produced in the burning of the fuel which produced it.
- Lower your meat consumption
In the United States the amount of deforestation that has taken place in the name of larger pastures for cattle grazing, or corn production to feed cattle, has contributed to something like 10 percent of the increase in C02 emissions. Another 10 percent or so of U.S. emissions is produced by livestock, agricultural soil management and rice production.
Reducing our dietary dependence on meat would go a long way to lowering the carbon footprint in this section [Ref. THEBEEF]. For example, for every one million calories consumed in the diet as a result of eating beef 220 tons of equivalent carbon dioxide emissions are produced [Ref. FOOTPRINT]. The corresponding number for chicken is 30 tons, and the number for fruits and vegetables is just 4.3 tons. Calorie for calorie, beef produces more than 50 times the emissions than fruit and vegetables.
Lowering meat consumption also reduces our water footprint. You may be shocked to learn that for every quarter-pound hamburger you consume about 460 gallons of water were required to raise and process the beef [Ref. OGALLALA3].
One alternative is to switch to cultured meat. This is meat grown in the laboratory in bioreactors. It is literally the exact same organic produce that would be grown in the form of a cow if it was raised on farmland, but it is done efficiently in a laboratory minus the cow. There are a number of benefits beyond just the lowering of the carbon footprint, not least of which is that it is a very clean process resulting in meat that is never exposed to the E. coli contaminants that plague slaughter houses.
Vegetable proteins can also be made to mimic the properties, texture, and taste of real meat. But it has a significantly smaller carbon footprint. This meat substitute is also healthier than the real thing, which correlates with higher incidence rates of cancer and heart disease.
So, there ARE sensible alternatives we can turn to so as to dramatically lower our dependence on livestock as a food source. We just have to stop acting like three-year olds and demanding to be able to push to the side of our plate anything that isn’t what we have been used to eating until now.
- Spread the word
We have the know-how to decarbonize the world. The technologies have been developed that would allow us to transition away from a fossil-fuel based economy to one powered by clean energy. But until people demand their elected representatives put in place policies to encourage the transition (such as a carbon tax) it is not going to happen at the rate required to avert disaster.
So people need to be woken up. Fast. That means if you want to be a part of the solution you need to let others know you are thinking about these issues and therefore that they also have permission to think and talk about these issues. It is important that they hear your opinion rather than the opinion of climate skeptics and deniers, people who are acting in opposition to your interests and the interests of your children.
Until climate change becomes a matter of public debate nothing will change. Not until the noise created by the electorate is able to drown out the currently much louder message which is coming from well-heeled fossil fuel industry lobbyists – people who are paid to ensure we remain tethered to coal, oil, and gas regardless of the long-term cost to the environment and livability of the planet.
- Become a carbon monitor / sustainability expert (for the company that employs you)
Bring the problem to the attention of management. Perhaps give a company talk on the issue of decarbonization, but keep it light, emphasize the positive aspects to doing business with a low carbon footprint (can be emphasized to clients, go in advertising, etc). Figure out what the carbon footprint of the company is and try to halve it (i.e. set an ambitious goal).
How do you do this? Go to the head of each department and ask them to figure out the corresponding number for their department. Get them to report their share of your power bill. Add up the numbers to make sure the department numbers tally with the bill. Once they do you have realistic targets to pursue (half the current numbers).
Improvement in energy efficiency is one of the easiest ways to lower your company’s footprint. But also think about what other factors are contributing. Add up all the miles employees spend on the road each week going to and from work. Try to reduce the mileage with work from home days. Introduce a recycling program (track down equivalent carbon savings for metal, glass, plastics and paper). The trash you’re tossing has a footprint to it and if it is being tossed at the company, that’s part of the company footprint!
Switch to a renewable energy provider, like Drift, a New York company that works with your electric power company to pull electricity from clean energy suppliers (solar, wind, hydroelectric power). This move alone can reduce your power bill by 20-30 percent. Check with Drift to see if its suppliers have integrated with your power company yet.
One perk of being a carbon monitor? You are building your company’s reputation of commitment to sustainability. This is an extremely valuable skill that can be applied anywhere you go.
- Divest from fossil fuel investments
If you have investments (e.g. pension funds) there is a very good chance part of them are vested in fossil fuel projects. Lobby to get your money taken out of those and put into renewable energies instead, or anything that is not fossil fuel based.
I would suggest you do this from a sense of moral obligation to the rest of society. But it makes sense from a financial point of view too.
At some point there is going to be a mad rush to divest from fossil fuel industries when the world finally realizes that unless we leave the bulk of the remaining reserves of coal, oil, and gas in the ground, we are just not going to make it. At that point the $20+ trillion dollars worth of fossil fuel assets into which your money may be invested is going to disappear virtually overnight. It will be like the great Wall Street crash of 1929. Economists call it the carbon bubble, and like the real estate bubble, or the dot com bubble before it, the carbon bubble is expected to eventually burst. The event will not just dent pocket books across the globe. It will bring down nations which have ignored the signs of impending collapse.
- Raise your consciousness
Watch documentaries dedicated to uncovering the realities of climate change. This will help convince you that everything I have tried to convey to you on this page is based on well-founded science and you are not crazy for believing that the scope of this problem is indeed of the magnitude I have presented.
- Years of Living Dangerously – Season 1 (Youtube: free viewing)
- Before The Flood – National Geographic. Narrated by Leonardo DiCaprio (Netflix)
Subscribe to a few climate change Youtube channels to keep you informed of the issues and apprised of news.
- Just Have A Think (examines the science)
- Hot Mess (short educational videos)
- Greenman3610 “knocks down the nonsense of climate denial”
I personally Google the phrase “climate science news” every day to find out what is happening on this issue. Does this make me seem a little obsessed about this topic? Probably. But if there was ever something it makes sense to be obsessed about I think this topic would be it. I would hope you become obsessed about it too. And all your friends and acquaintances. Because until the day arrives when we all admit how serious the problem is we are facing, we are not going to be able to marshal the will to combat it.
World Scientists’ Warning to Humanity: Final Notice
The great challenge climate change presents, the slow warming of the world to a point that makes the planet inhospitable to most forms of life including humans, is that it is accompanied by a time lag.
If we dump carbon dioxide into the atmosphere at a copious rate, as we have been doing for the last half century, the planet does not respond immediately. This is analogous to the way in which, if you throw an extra blanket on your bed in winter, you do not instantly warm up. The trapping of outgoing thermal energy by that CO2 blanket takes time. Also, the oceans are vast, they capture heat and only slowly return it to the atmosphere. If we stopped emitting greenhouse gases overnight the temperature of the planet would continue to rise for another few decades before leveling off. Given that we have yet to even begin seriously weaning ourselves off fossil fuels, and that it will take us at least two decades to do so once we commit ourselves, we are looking at a continuation of rising temperatures for at least the next half century.
We knew this 30 years ago when we had a chance to enact policies that would have capped the extent of the climate wrought devastation to something not significantly greater than what we are seeing unfold today. Perhaps we would have inherited a 1.5 degrees Celsius world.
But we ignored the warnings of the scientists. Now, no matter what we do at this point, we have committed ourselves to living through a period where every decade that passes we will wonder if it could be the last before runaway global warming kicks in and our fate is sealed. We will have to live our lives like death row inmates, forever wondering if our reprieve will come through in time. It is hard to imagine how we will conduct our lives with this terrible knowledge.
But, we were warned. In 1992 a group of concerned members of the Union of Concerned Scientists came together to try to wake us up to the dangers. They published an open letter: World Scientists’ Warning to Humanity. If the world did not act soon, they warned, the changes brought about by our plundering of Earth’s resources and massive reliance on the burning of greenhouse gas-producing fossil fuels would have dire consequences for all life on the planet [Ref. WARNING1992]:
“We the undersigned, senior members of the world’s scientific community, hereby warn all humanity of what lies ahead. A great change in our stewardship of the earth and the life on it, is required, if vast human misery is to be avoided and our global home on this planet is not to be irretrievably mutilated.”
In 2017, a quarter century later, another group of more than twenty thousand scientists issued an update: World Scientists’ Warning to Humanity: A Second Notice. In their letter you get the strong sense they would have liked to have declared it A Final Notice [Ref. WARNING2017]. In their new report they detail how, since the previous warning, things have got significantly worse on almost every front. We must now get by with fewer fresh water resources, less rain forest, much less wildlife, fewer livable marine zones and smaller fishery catches. What’s up rather than down? We’re emitting more greenhouse gases than ever, and we’re producing more resource-depleting livestock and human beings.
In short, we have behaved as though sustainability was little more than a theoretical concept – not a real-world physical constraint that will cause the “vast human misery” that the 1992 authors warned of and which seems now all but assured in the coming decades.
The only question that remains is whether or not we, as a collective species (and not just as a few hundred thousand concerned citizens across the world), will recognize the dire nature of the future we have signed up for and immediately take action. If we do, maybe we survive the next 50 years and get the chance to figure out how to repair the damage we have done. Maybe humanity survives.
But for that to happen, we will have to wake up very quickly.
~//~
Addendum: What To Think About The Skeptics And The Deniers
If you arrived at this section of the article after having read everything that precedes it I would hate to think you might now click away to some other article that undermines everything I have just told you. It would be more than a shame if you then took that author’s word for it that THEIRS is the real truth on the matter of climate change – a “truth” that amounts to the claim that the worries of the scientists are either overblown or just flat out wrong.
So much is at stake on this issue that I think the matter is worth dwelling on for a moment.
I spent a lot of time during the research for this article assaying the opinions not just of the climate scientists but also their detractors.
I did this not because I wanted to afford them “equal air time”. But because I would have loved to have been able to find just one skeptic or denier able to present me with irrefutable proof that the scientists just do not know what they are talking about. That all the fuss they have been making about the dangers of climate change (global warming) are simply unwarranted or massively exaggerated.
Because that would take me (you) off the hook. We could relax and go on with our lives. We could sleep soundly and not worry about the future of our children.
Unfortunately, on every occasion I gave my attention to evaluating the claims of the climate science naysayers it did not take long to figure out that I was listening to people drunk on a message based on unsound arguments. Sometimes, I will admit, they do sound convincing at first. In fact members of these very vocal groups are so sure of their arguments that it works as a strong tell that you should be suspicious of what you are hearing from them.
Almost to a person, those who articulate the evidence FOR global warming as a human-caused phenomenon are very deliberate in their presentation of the facts. They are of a studied, almost sober disposition, as you would expect of someone delivering evidence for a subject of such import.
Skeptics and deniers on the other hand project a very different feeling about their conclusions. They often present in gleeful, mocking tones. They deride and dimiss scientific evidence with arguments that, on the surface sound like there might be something to them, but which always turn out to be a red herring.
For the average person who does not have the benefit of a scientific education, the holes in these fallacious arguments are virtually impossible to detect. Often I would think to myself “Wow, if what this person is saying is true this is really important!” Then I would go away and check it for myself. Never once did any of these claims have real supporting evidence. Instead I would find they had either completely misinterpreted the data they were talking about, or they were parroting the conclusions of someone else who had done so, or they were parroting a parroter.
Be very suspicious of anyone delivering climate science opinion who strikes you as either being utterly convinced of their opinions, or appears almost overjoyed about their conclusions. If they are making jokes at the beginning of their presentation to win you over, this is a dead certain tell that what you are about to hear is gibberish presented in the form of irrefutable science.
What is astonishing is just how many untrained people there are out there who – presumably because they have some familiarity with weather – feel confident in telling you “the facts” about climate science.
This is almost surreal. As a physicist I studied/trained for years to be able to use computer modeling to simulate and predict the evolution of real world systems. It was hard work. I never once thought my intuition would be more reliable than careful mathematical modeling. It would be exactly the same for modeling scenarios in climate science. Having a “feel” for how the world works is never going to be a reliable substitute for precision study of a complex system.
And yet Joe Public will get on Youtube and deliver his opinions about why all the conclusions of scientific studies in the area of climate science for the last 100 years are wrong. He would never be so bold as to try to negate the findings of a century’s worth of nuclear science, chemistry, astrophysics, or material sciences. But for some reason he thinks he is privy to the secrets of climate in a way that actual climate scientists who have been studying the field for decades are not.
Ultimately, these people are easy to dismiss. They cannot think clearly and are predisposed to accepting points of view which require no investment of mental energy. On the one hand we have the skeptic and the denier, both of whom, to join their respective clubs, need only to utter variations of the theme: “That’s nonsense, who do these scientists think we are? Idiots?” And on the other hand we have the scientists who have labored for years or decades to uncover the truth, and who are ALWAYS looking for flaws in what it is we think we know about a subject.
So, who do you think is more likely to be a better source of truth on these matters?
That’s right. Most scientists are too busy doing the work and writing peer-reviewed papers to be hanging out on Youtube and trying to convince you that their point of view is the correct one. Keep this in mind the next time you come across someone in your social feed who claims to be breaking the latest news about how climate scientists have just been caught in their own lies yet again. Dollars to donuts, you are about to be fed more nonsense.
- [HAWKINS] Warming stripes (by Ed Hawkins)
- [NOAA] Climate Change: Global Temperature (NOAA)
- [BASELINE] Defining ‘pre-industrial’
- [POPMECH1912] Remarkable Weather of 1911 (Popular Mechanics: March 1912)
- [ARRHENIUS] Svante Arrhenius: On the Influence of Carbonic Acid in the Air upon the Temperature of the Ground
- [FOOTE] Circumstances affecting the heat of the sun’s rays (Eunice Foote 1856)
- [XKCD] Explain XKCD: Thickness of the ice sheets
- [SENS] How sensitive is our climate?
- [NYTIMES] Warmer Climate on the Earth May Be Due To More Carbon Dioxide in the Air (New York Times, 1956)
- [POPMECH1953] Growing Blanket of Carbon Dioxide Raises Earth’s Temperature (Popular Mechanics: Aug, 1953)
- [PLASS] Gilbert N. Plass: Carbon Dioxide and the Climate (American Scientist 1956)
- [CONSENSUS] Is there a scientific consensus that Global Warming is happening and humans are causing it?
- [CATO] Data pre-processing for Climate Spirals Visualisation [CATO EMISSIONS GRAPH]
- [GARDNER]Alex Gardner, Jet Propulsion Laboratory
- [MEEHL] Combinations of Natural and Anthropogenic Forcings in Twentieth-Century Climate
- [OCEAN] The Most Powerful Evidence Climate Scientists Have of Global Warming
- [PAGES] Most Comprehensive Paleoclimate Reconstruction Confirms Hockey Stick
- [MARCOTT1] MARCOTT graphs
- [MARCOTT2] 20,000 Years of Global Temperatures: Asst. Prof Shaun Marcott (Youtube June 2015)
- [SIM1] simulated ice-age ending temperature rise
- [SIM2] Global warming preceded by increasing carbon dioxide concentrations during the last deglaciation
- [MODELLING] Timeline: The history of climate modelling
- [HANSEN2008] Target Atmospheric CO2: Where Should Humanity Aim?
- [EURASIAN] The build-up, configuration, and dynamical sensitivity of the Eurasian ice-sheet complex to Late Weichselian climatic and oceanic forcing
- [OXYGEN18] How are past temperatures determined from an ice core?
- [HANSEN2007] Climate change and trace gases
- [ARCTICFIRES] The global heat wave as seen by satellites, airplanes, and weather stations
- [SEALEVEL] Earth Under Water Worldwide Flooding Sea Level Rise (Nat. Geographic)
- [HEARTY] Global sea-level fluctuations during the Last Interglaciation (MIS 5e)
- [BROWN3] The Last Interglacial Part Three – Melting Ice and Rising Seas
- [MILAN1] Is an Ice Age Coming? | Space Time | PBS Digital Studios (Milankovich cycles explained)
- [MILAN2] Milankovitch cycles
- [MILAN3] Dan Britt – Orbits and Ice Ages: The History of Climate (Youtube)
- [BROWN1] The Last Interglacial – An Analogue for the Future?
- [KOPP] Probabilistic assessment of sea level during the last interglacial stage
- [POLLARD] Contribution of Antarctica to past and future sea-level rise
- [ICEBRIEF]Piecing together the Arctic’s sea ice history back to 1850
- [2040ICE] Will the Arctic be free of summer sea ice in 30 years?
- [ARCTICSUN] Present status and variations in the Arctic energy balance
- [RADFORCE] Climate Change Indicators: Climate Forcing (EPA)
- [AR5CHAP8] AR5 – Chapter 8: Anthropogenic and Natural Radiative Forcing
- [VORTEX] Polar Vortex: How the Jet Stream and Climate Change Bring on Cold Snaps
- [DRY2004] Disappearing Arctic sea ice reduces available water in the American west
- [GREENHOUSE] Endless Summer: Living With The Greenhouse Effect (Discover Magazine 1988)
- [SIERRASNOW] Water shortages ahead? Sierra Nevada snow pack on track to shrink 79 percent, new study finds
- [DROUGHT] Permanent drought predicted for Southwest
- [98MER] Dividing line: The past, present and future of the 100th Meridian
- [GROUNDWATER] PUMPED DRY: The Global Crisis of Vanishing Groundwater
- [OGALLALA] The Ogallala Aquifer: Saving a Vital U.S. Water Source
- [OGALLALA2] Drying times: Could the rapidly depleting Ogallala Aquifer run dry?
- [OGALLALA3] What Happens to the U.S. Midwest When the Water’s Gone?
- [WATERWARS] The Water Wars of Arizona
- [FOODCRISIS] How Can We Avoid A Food Crisis That’s Less Than A Decade Away
- [SHOCKS] Climate change could heighten risk of global food production shocks
- [CORNSTRESS] How Extended High Heat Disrupts Corn Pollination
- [YIELD2003] Historical Warnings of Future Food Insecurity with Unprecedented Seasonal Heat
- [GERMANDROUGHT] German Farmers Struck By Drought Fear Further Damage From Climate Change
- [95CDAYS] 95-Degree Days: How Extreme Heat Could Spread Across the World
- [FARMERS] Politicians say nothing, but US farmers are increasingly terrified by it – climate change
- [PARIS2015] What is in the Paris climate agreement?
- [EPIPELAGIC] What is a thermocline?
- [HOTHOUSE] Trajectories of the Earth System in the Anthropocene
- [METHANE] CRITICAL THINKING ACTIVITY: THE METHANE CYCLE
- [IPCC2018] Global Warming of 1.5 °C – Full Report (IPCC October 2018)
- [IPCCSR15] Global Warming of 1.5 °C – Summary for Policymakers
- [THEBEEF] Our meat addiction is going to kill our chances of beating climate change
- [FOOTPRINT] Environmental Impact by Food Type (Calories)
- [WARNING1992] World Scientists’ Warning to Humanity (1992)
- [WARNING2017] World Scientists’ Warning to Humanity: A Second Notice